This tutorial provides step by step instructions on how to install Ubuntu 20.04 with a GNOME environment.
As announced on the Ubuntu official website, Canonical has just released a brand new version of Ubuntu on the 23th of April 2020.
Named Focal Fossa (or 20.04), this version of Ubuntu is a long term support version offering the following new features :
- The GNOME (v3.36) environment is available by default when installing Ubuntu 20.04;
- Ubuntu 20.04 uses the v5.4 of the Linux kernel : as a reminder, it adds some interesting memory management improvements as well as compatibility with many different hardware devices;
- Ubuntu toolchain has been upgraded : it now uses Python 3.8.2, OpenJDK 11 (or JavaSE 11), GCC 9.3 and recent versions of NGINX and Apache;
- Ubuntu desktop environment has seen some improvements and now looks more recent and modern;
- Improvements have been made on the ZFS filesystem such as native encryption, improved device removal and pool TRIM.
Now that you have a complete idea of the new features of Ubuntu 20.04, let’s see how you can install Ubuntu easily on your computer or server.
Here are the steps to install Ubuntu 20.04.
Create a Bootable Ubuntu 20.04 on Linux
Unless you are working on a virtualized environment (such as VirtualBox), you will need to create a bootable USB stick in order to start the installation.
As a quick reminder, if you are working on Windows, you will have to use Rufus but the steps are essentially the same.
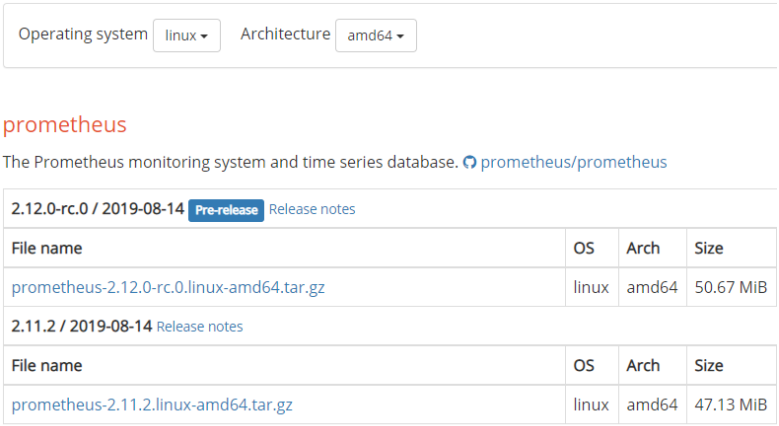
The Ubuntu 20.04 ISO file is available on the official Ubuntu website.
- How to Install Nvidia Drivers on Ubuntu 20.04
- How to Install Python Pip on Ubuntu 20.04
- How to Install Eclipse IDE on Ubuntu 18.04
When visiting the website, you essentially have two options :
- Download an ISO file containing a desktop environment: this is suited for personal computers as well as system administrators not very familiar with the shell environment.
- Download an ISO file for server administration: you may need to choose this version if you don’t need the desktop environment and rather have features such as an SSH server installed by default.
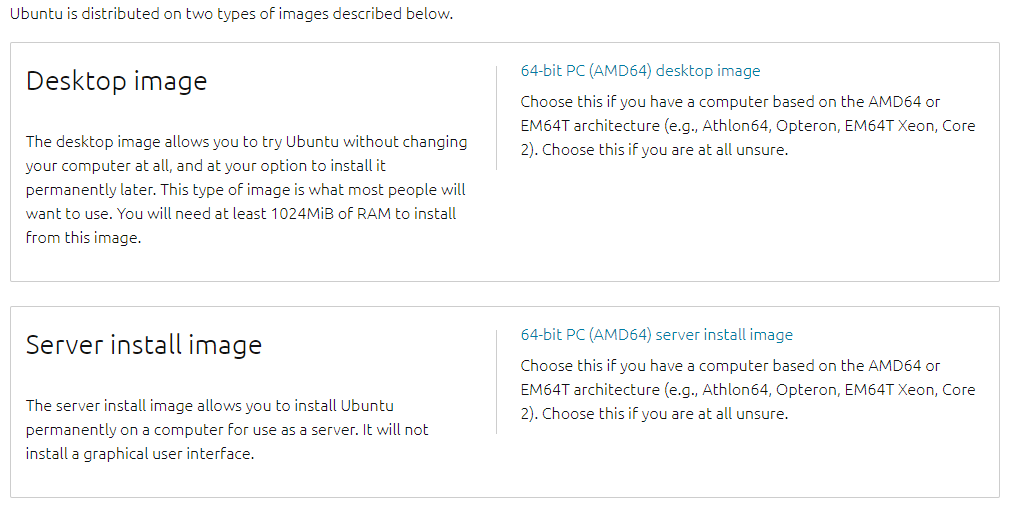
For this tutorial, we are going to use the ISO file containing a desktop environment.
First of all, make sure to plug the USB stick where you want the ISO file to be stored : the ISO file is about 2.5 GBs in size, so make to choose a large enough USB stick.
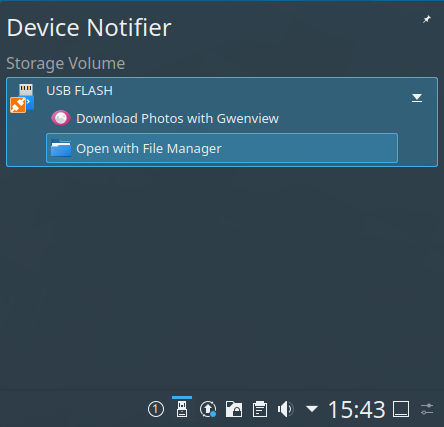
Plug the USB stick in the USB port
When inserting the USB stick, your distribution should automatically detect the new device.
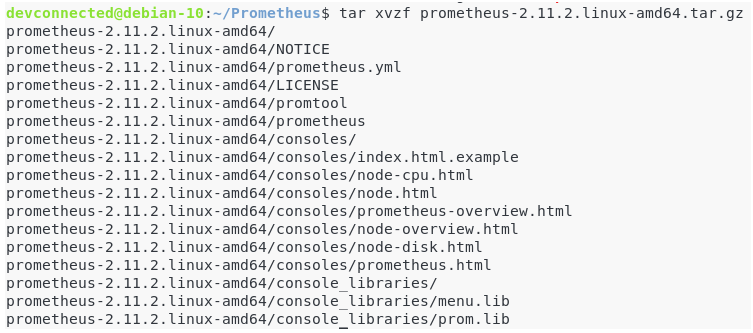
You can also check that your device was correctly mounted by running the following command
$ df
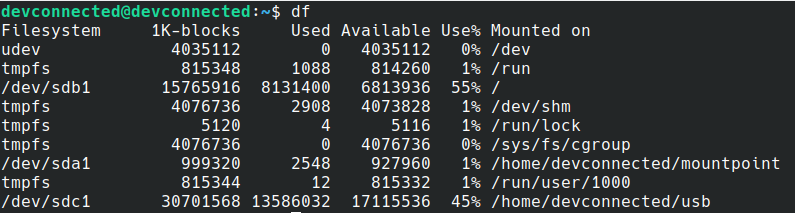
In this case, the USB stick is linked to the “sdc” filesystem and mounted on the “/home/devconnected/usb” mountpoint.
If you are not very familiar with filesystems and partitions, make sure to read our guides on mounting filesystems.
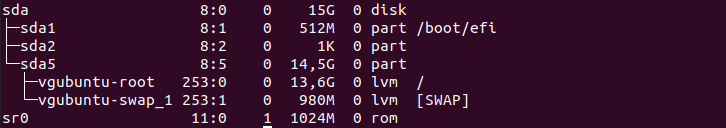
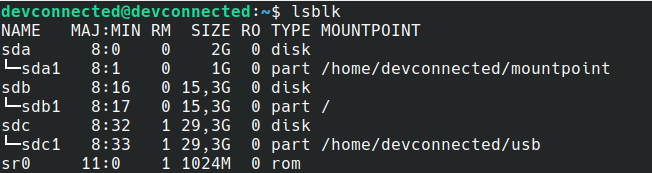
If you have any doubts, you can also use the “lsblk” command in order to list all block devices available on your computer.
$ lsblk
Download Ubuntu 20.04 ISO file
In order to download the ISO file, you have two options : you can either download it directly from the website provided before or use the wget command in order to download the file.
As a reminder, we are going to install the image containing the desktop environment.
In order to download it, execute the “wget” command followed by the link to the ISO file.
$ wget https://releases.ubuntu.com/20.04/ubuntu-20.04-desktop-amd64.iso
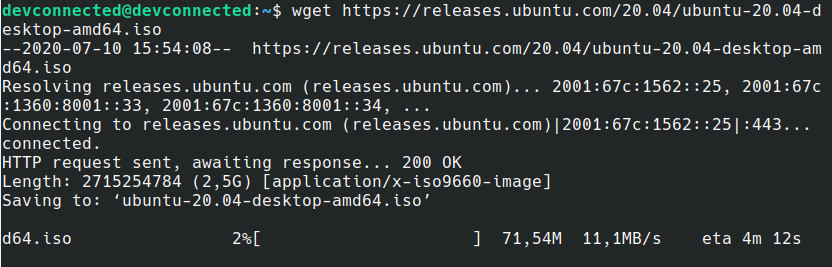
After a while, the ISO file should be downloaded on your machine.
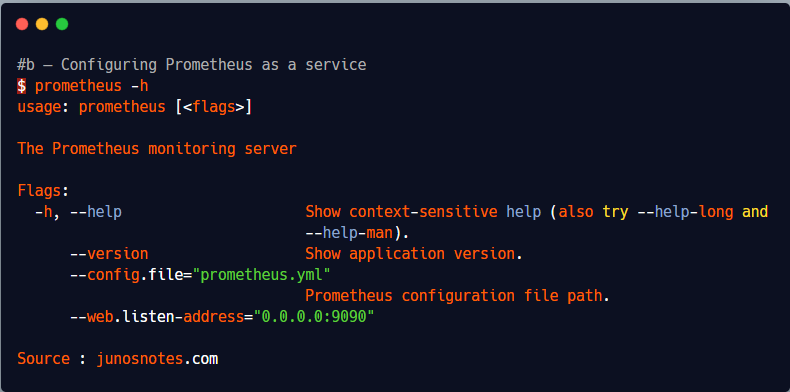
Copy the image to your USB drive
Now that the ISO is downloaded, it is time to copy it to your USB drive.
$ sudo dd bs=4M if=ubuntu-20.04-desktop-amd64.iso of=/dev/sdc && syncBoot on the USB drive
Now that your USB stick is ready, you are ready to boot on it.
Depending on the BIOS you are using, you may need to press one of the following keys to escape the normal boot : ESC, F1, F2 or F8.
Install Ubuntu 20.04 from your USB drive
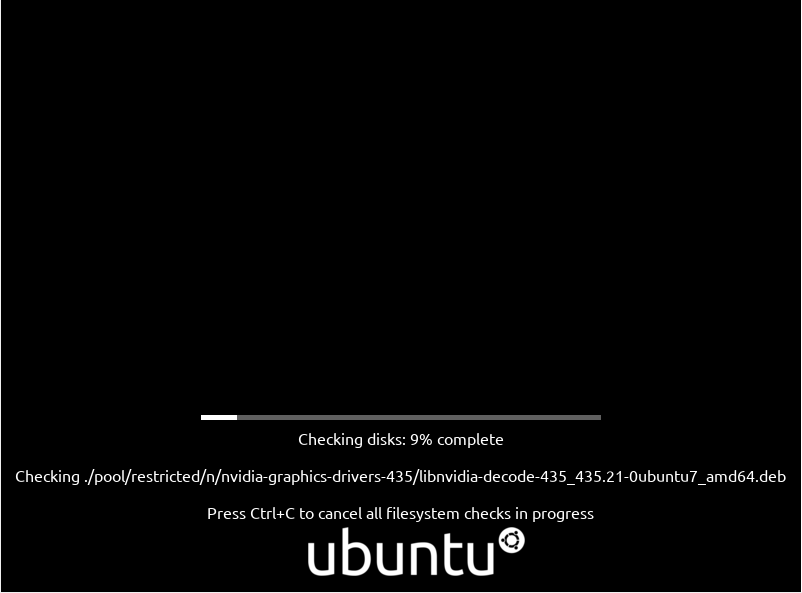
Now that you booted directly from your USB drive, you should see the following screen.
Ubuntu will simply start to check files and their integrity to make sure that you have the correct ISO version.
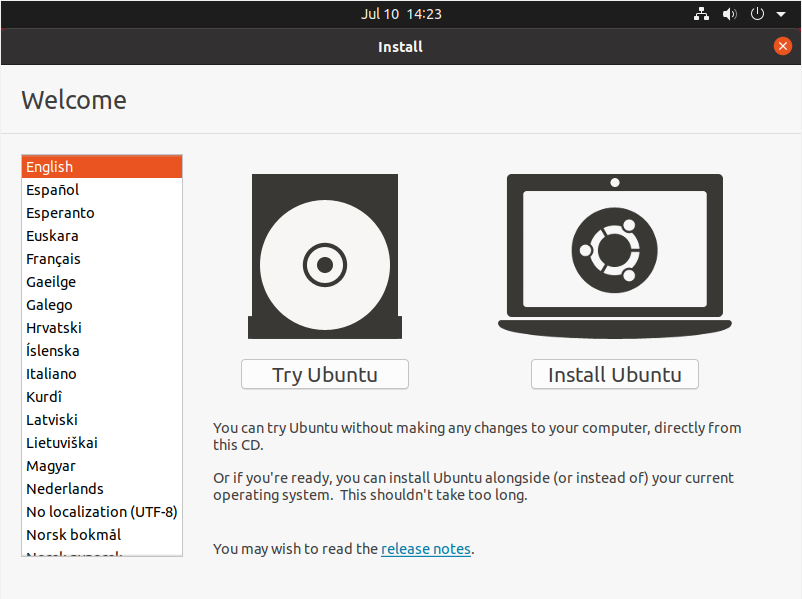
When this step is done, you will be prompted with this window : you can either try Ubuntu or install Ubuntu.
In our case, we are going to install Ubuntu.
Follow Ubuntu installation steps
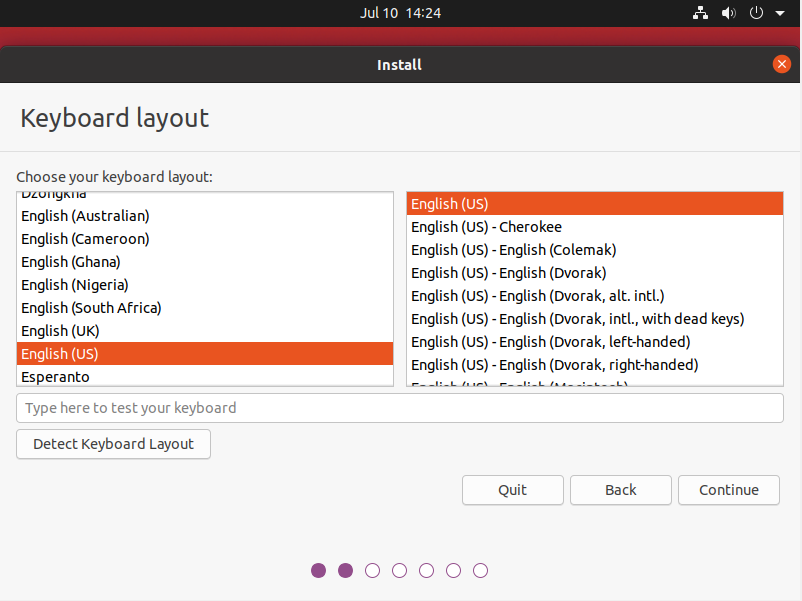
On the next screen, you are immediately asked to choose a keyboard layout for your computer.
For the example, we are going to choose “English (US) > English(US)”, however feel free to choose the layout that you feel comfortable with.
When clicking on “Continue“, you are asked the type of installation that you want.
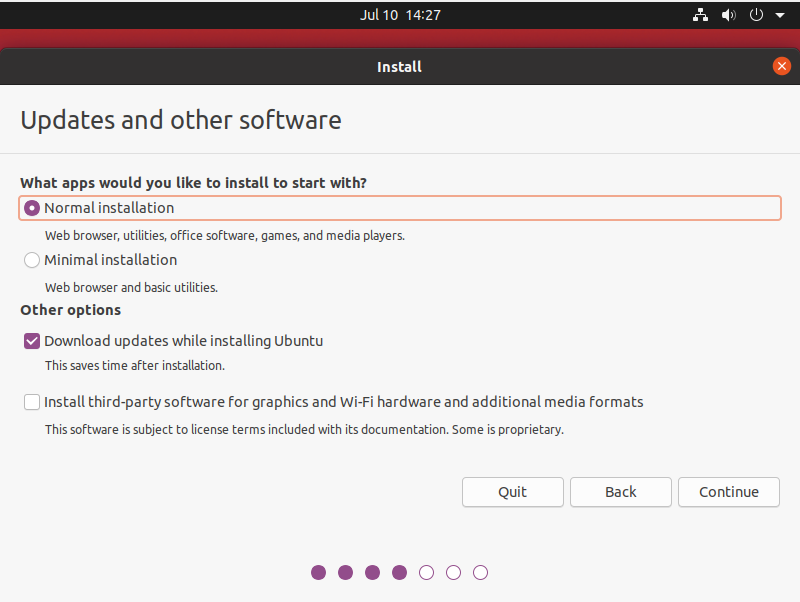
As we are targeting a rather minimal installation of Ubuntu, we are not going to install the third-party software suggested. We can install them later on when needed.
Stick with the defaults and click on “Continue“.
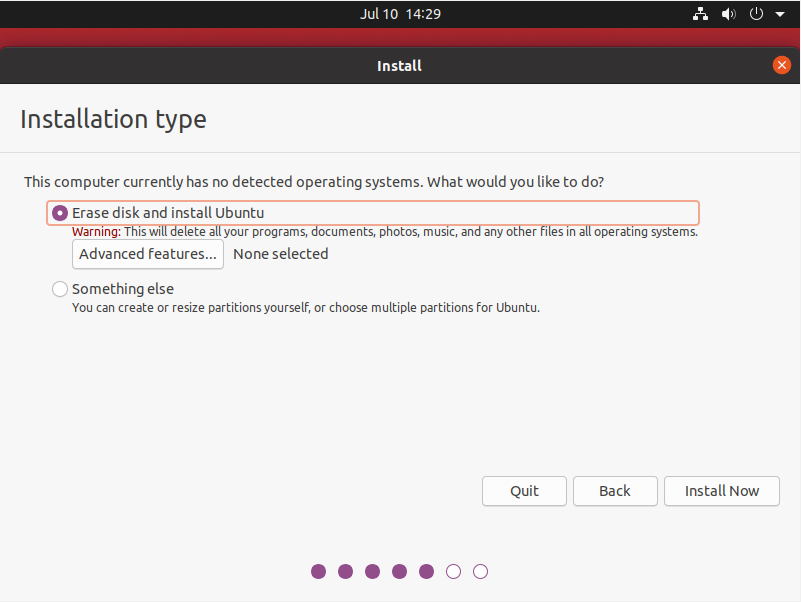
Next, you are asked for the partitioning that you want to perform on your instance.
Usually, you can stay with an automatic partitioning (which is essentially “Erase disk and install Ubuntu“).
If you are an advanced system administrator, and if you want to have your own partitioning, you can go for the other option.
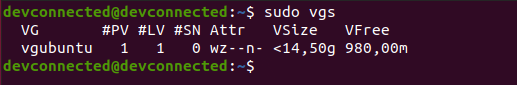
However, even if you are going for an automatic partitioning, make sure to have LVM setup from the beginning.
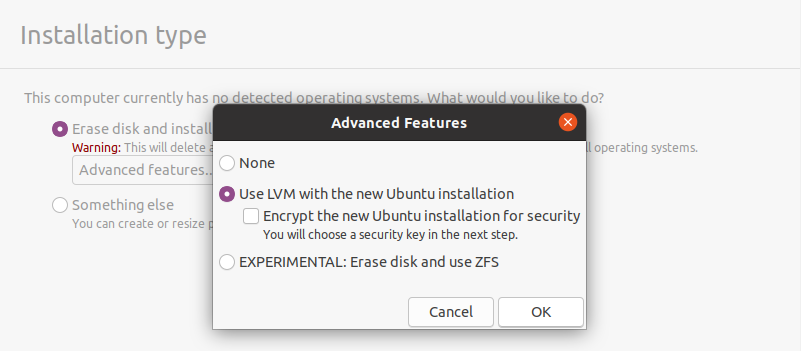
Also, if you are not very comfortable with LVM and dynamic volume management, make sure to check our advanced guide on LVM.
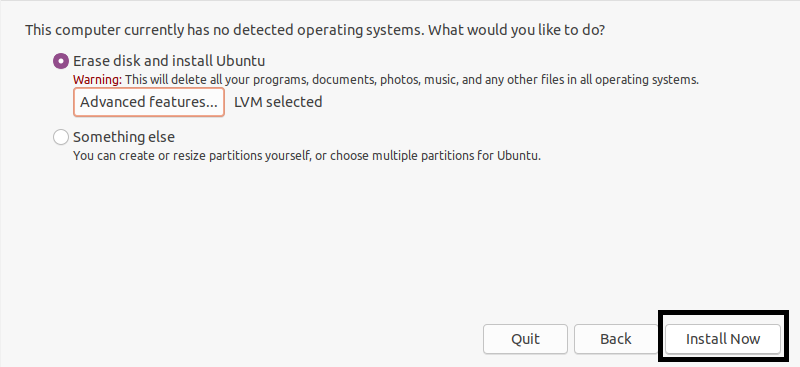
Disk encryption will not be used, however if you need this security, make sure to check the encryption box.
Now that everything is ready, you can click on “Install Now” at the bottom of the previous window.
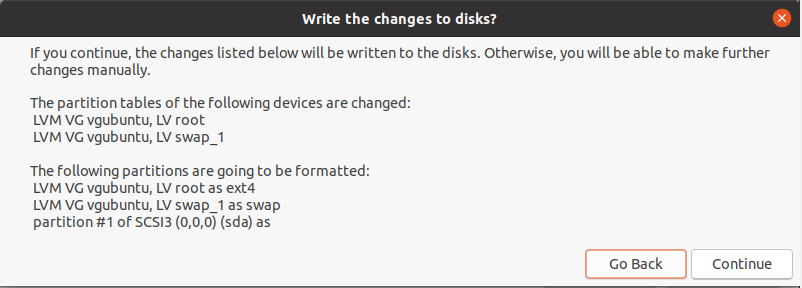
A confirmation window will open asking if you are sure with all the changes that are going to be performed. Read carefully this window as you won’t be able to go back after clicking on “Continue“.
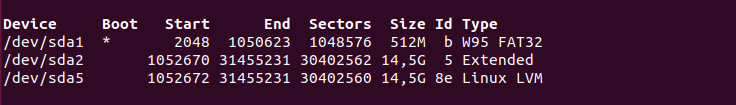
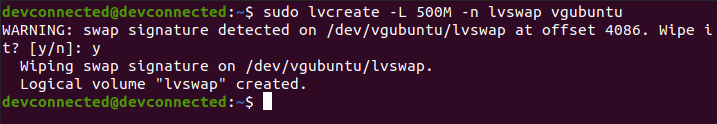
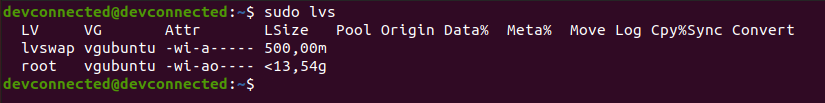
Essentially, the installation wizard will create one partition (named sda) on your computer and it is going to create two volume groups : one for your root filesystem and one for the swap partition.
Click on “Continue” when you have carefully read the modifications.
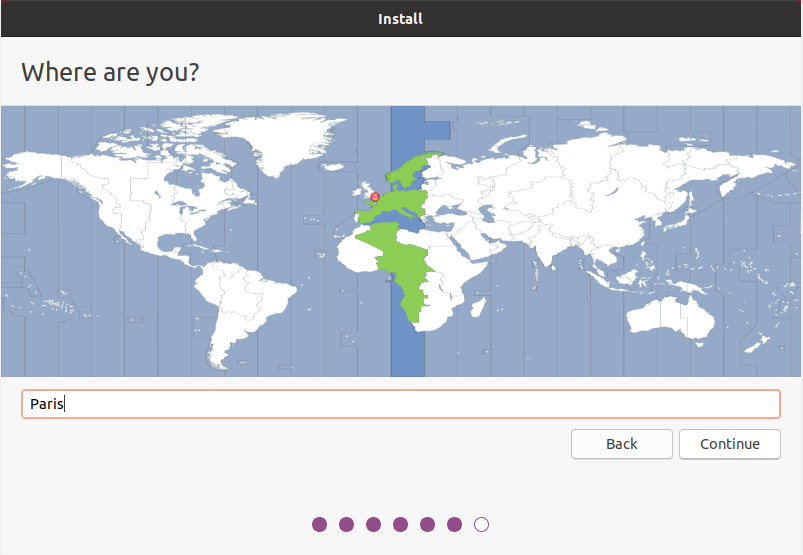
On the next screen, choose your location on the map by clicking directly on it and click on “Continue“.
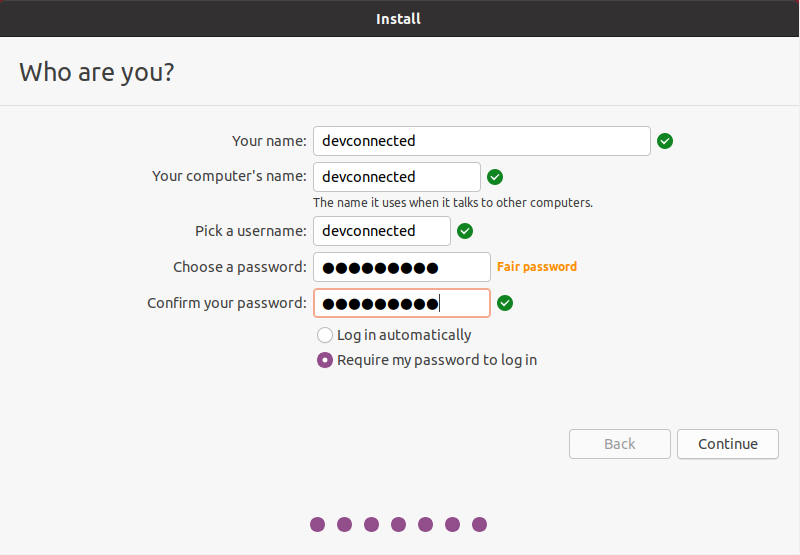
Finally, you are going to create a user for your instance, make sure to choose a name, a computer name (in order to identify it over the network) as well as a secure password.
If you are working on a local network, make sure to choose a computer instance name that is unique, otherwise you might create conflicts related to DNS.
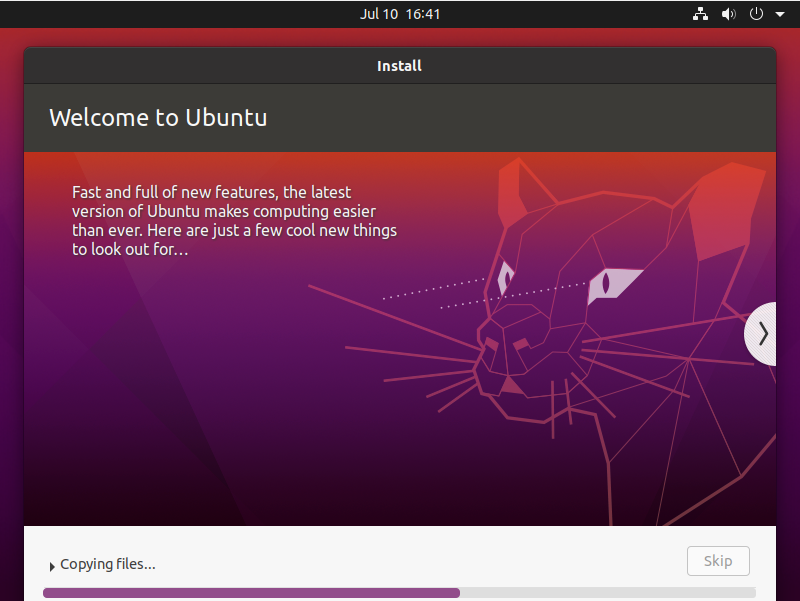
From there the installation will start.
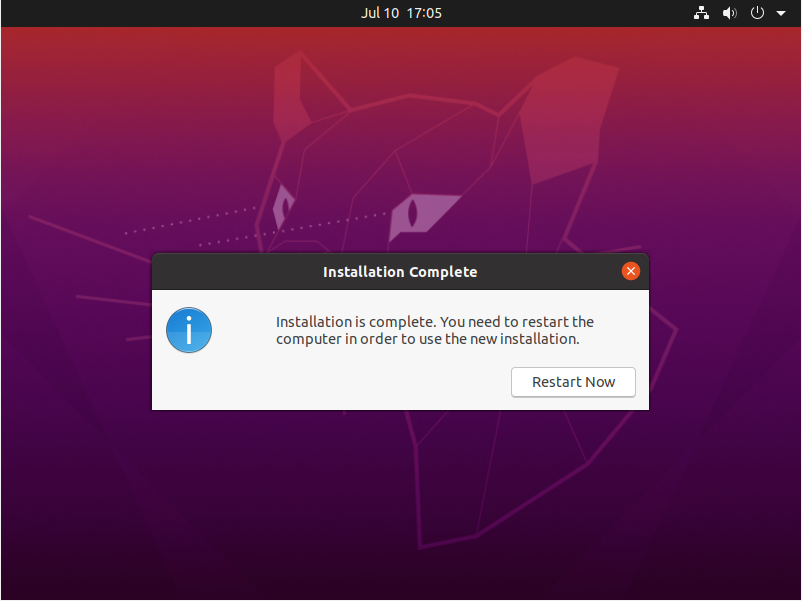
Reboot your system on installation complete
When the installation is done, you will be prompted with a window asking you to restart now.
Click on “Restart now” and wait for the system to start booting up again.
Boot in your new Ubuntu image
Now that the system is started, the user you created in the installation process is automatically selected.
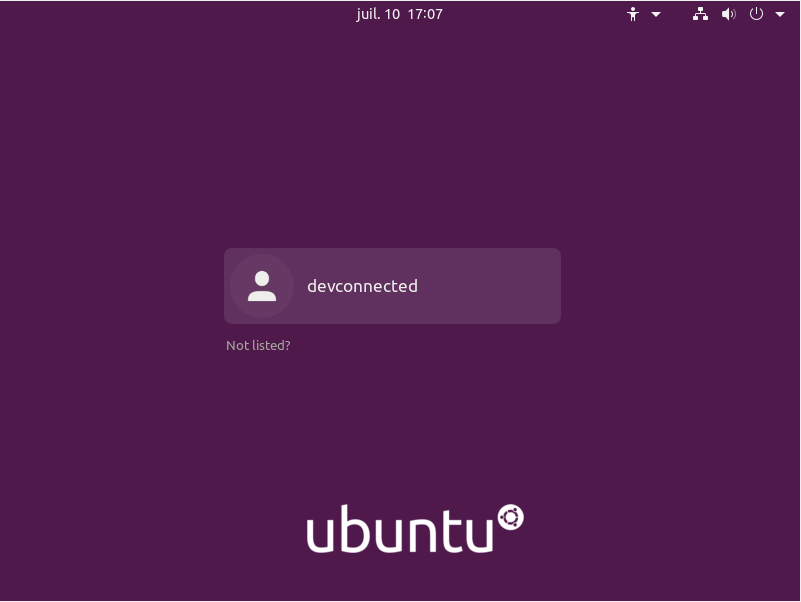
Use the credentials specified before and log in into your newly created account.
Once you are logged in, pretty much like in the CentOS installation, you will be asked to connect your online accounts (meaning email and social accounts).
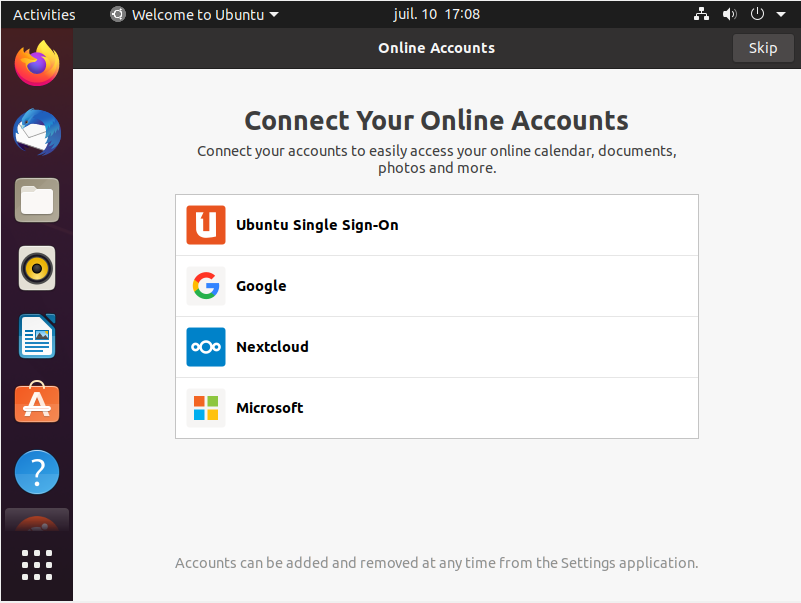
For this tutorial, we are not going to connect any accounts, but feel free to do it if you want to.
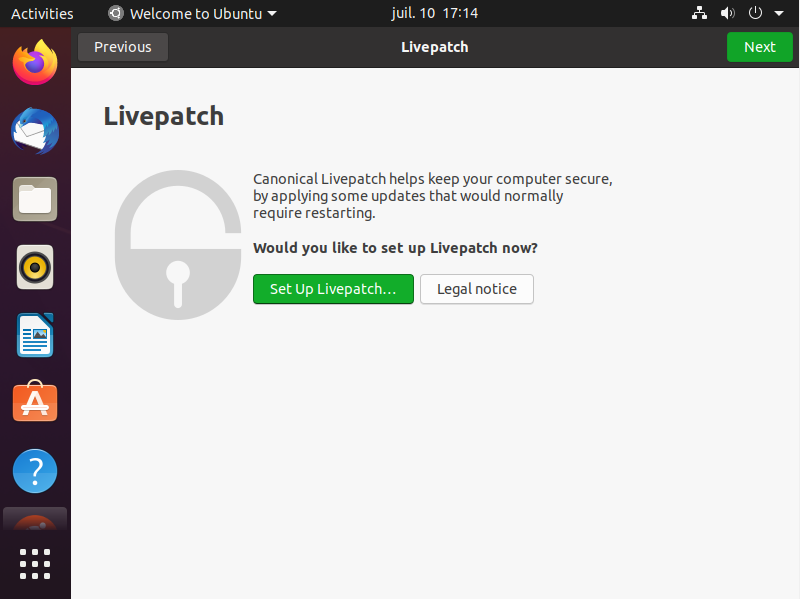
Livepatch setup
Next, you will be asked if you want to install Livepatch. In short, Livepatch is used to install critical features that would usually require a system reboot.
In production environments, this is a crucial feature as your server might be the host for websites or applications that cannot be easily interrupted.
To install Livepatch, simply click on “Set up Livepatch” in the initialization wizard.
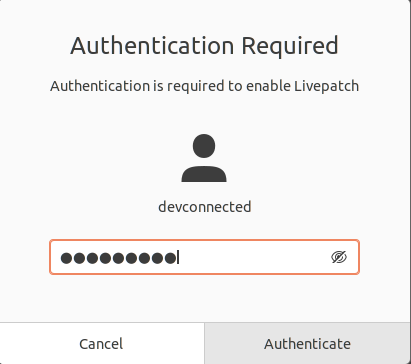
You will be asked to provide your credentials in order to complete this step.
Also, you will be asked to have an Ubuntu account in order to setup Livepatch. If this is not the case, make sure to create a Canonical account if you don’t have one already.
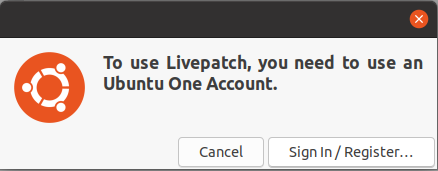
In this case, we already have a Ubuntu account, so we are simply going to connect to it.
When this is done, Livepatch will be enabled and active on your system.
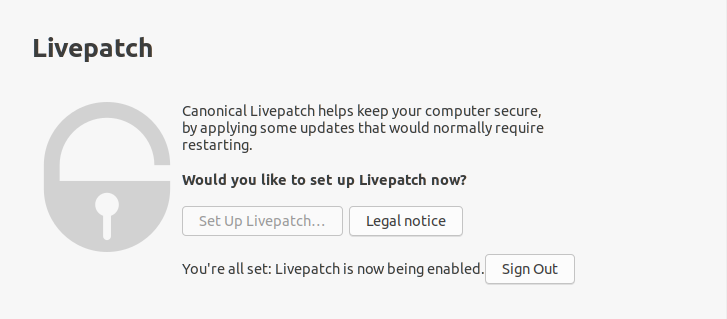
Awesome, you can click on “Next“.
Complete final installation steps
You are almost at the end of the process.
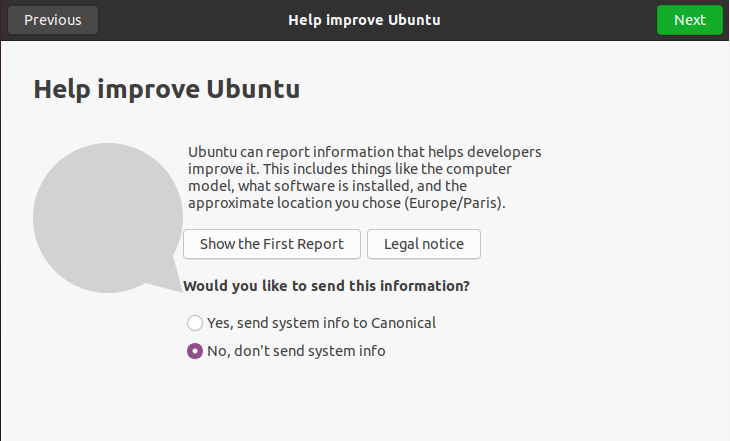
Then, you are asked if you want to send statistics and computer information directly to Canonical.
For this step, you can choose if you want to send information or not, but for the tutorial, we are going to choose not to do it.
Click on “Next“.
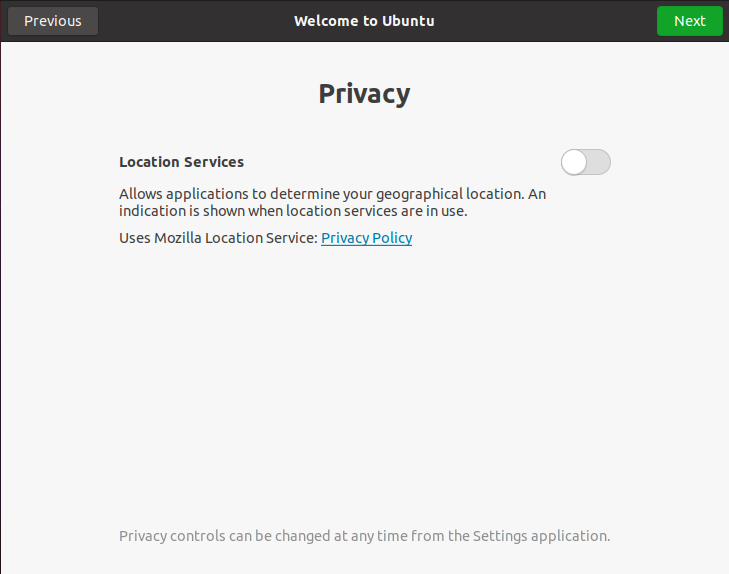
Again, you are asked if you want applications to have your geolocation. I would recommend to have this option desactivated for now.
If an application needs your geolocation, you will be prompted with it anyway. As stated, “privacy controls can be changed at any time from the “Settings” application.”
Ready to go!
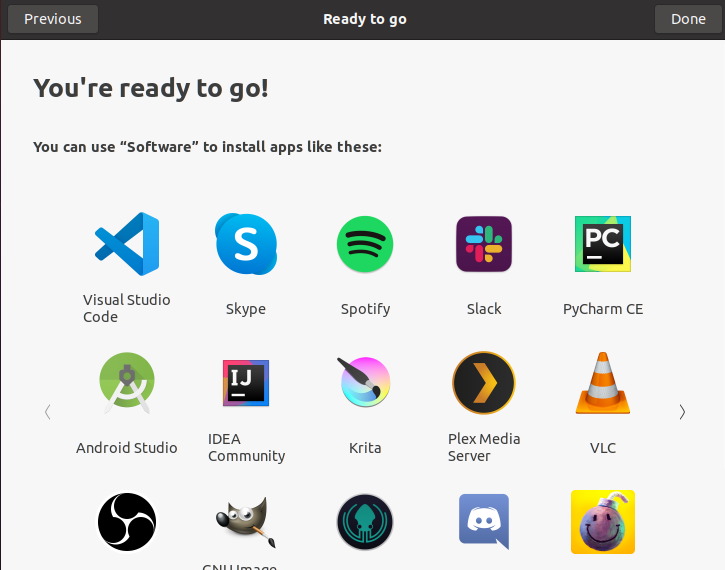
You have successfully completed the Ubuntu 20.04 installation, and you will be able to have all those amazing tools via the “Software” application.
Going Further with Ubuntu 20.04
Now that your server is completely installed, you are ready to create your users and install software that will be needed throughout your Ubuntu journey.
Update your Ubuntu server
First of all, after installing your server (especially if you installed Livepatch in previous steps) you will be prompted with some basic software update.
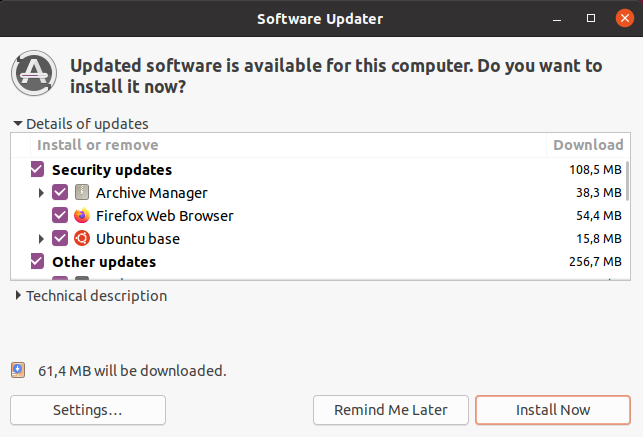
Simply click on “Install” and wait for the updates to be completely installed.
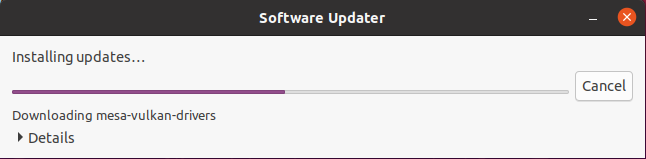
At the end of the installation, you will be required to restart your server.
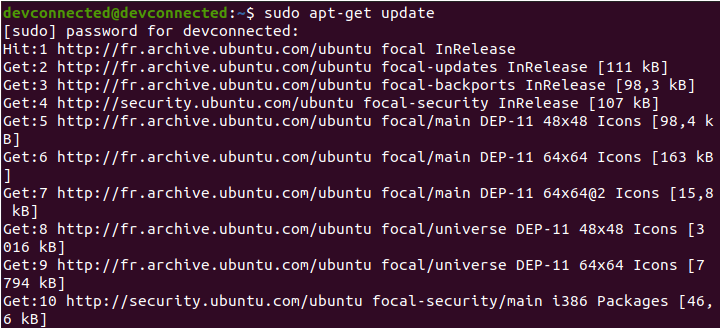
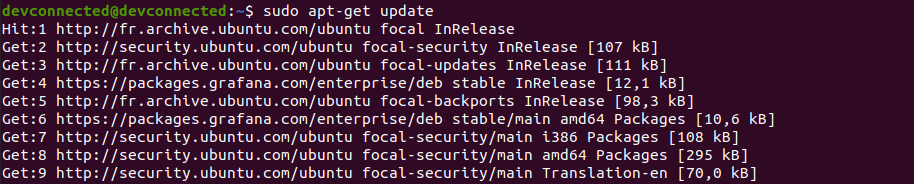
If you don’t have this option available, note that you can install update manually by using the APT package manager.
# Updates cache with newly available software
$ sudo apt-get update

# Applies updates downloaded with the previous command
$ sudo apt-get upgrade
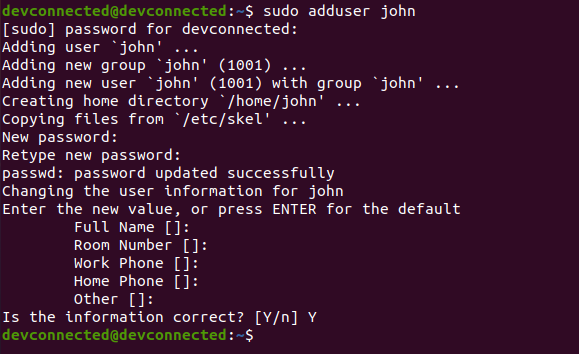
Adding your first user
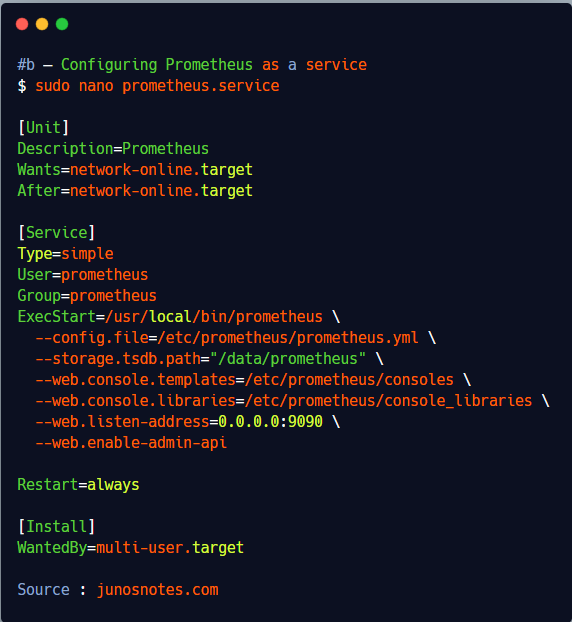
In order to add your first user to your Ubuntu 20.04 server, use the following command
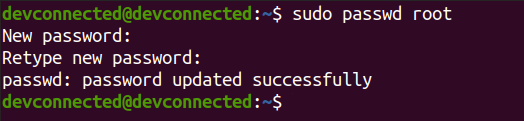
$ sudo adduser <user>
$ sudo passwd <user>
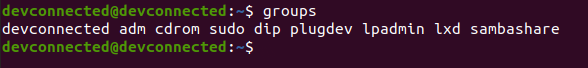
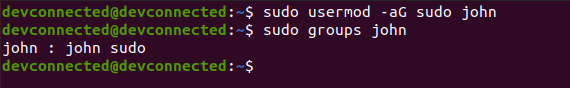
Adding a user to administrators
In order to add a new user to administrators, use the following command
$ sudo usermod -aG sudo <user>

Conclusion
In this tutorial, you learnt how you can easily install the most recent Ubuntu version : Focal Fossa or Ubuntu 20.04.
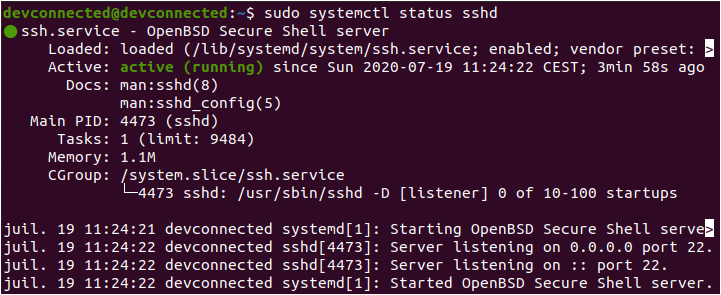
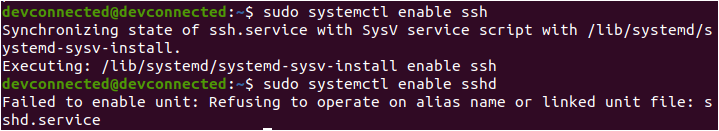
This tutorial covers the very first steps of server creation, however you might want to set up a SSH server or install reverse proxies on your server. Those aspects will be covered in our upcoming tutorials.
Until then, we recommend that you familiarize yourself with your new distribution, more specifically with the software installer that contains all the useful software.