Best Software Engineering Books

The 10 Best Software Engineering Books in 2021 | Ten Must-Read Modern Software Engineering Books

Learning the subject from various modern world options like podcasts, videos, blogs, expert classes, etc. can be your wishlist but reading a good book is the final order where people enjoy & gain knowledge without any loss. Hence, find the best software engineering books & kickstart your learnings.

Discovering the top-most Software engineering textbooks in 2021 can be difficult for everyone. But people who have viewed our article can find it very easily and effortlessly. As we are going to give you a compiled list of the best books on software engineering subjects where recommended by a few experts.

Before going to review all these top 10 best software engineering books in 2021 that are available in this tutorial, we want to suggest you view and remember a few factors that help you select the right book for your further learnings. They are as fashioned:

  • High Recommendations
  • Editor Reviews
  • Hardcover/paperback
  • Pricing

This tutorial completely focuses on the best software engineering books available for software engineers, developers, and project managers.
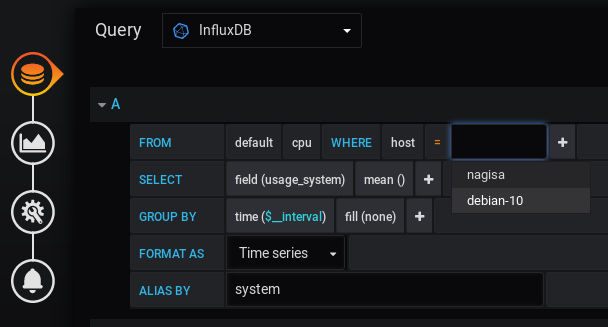
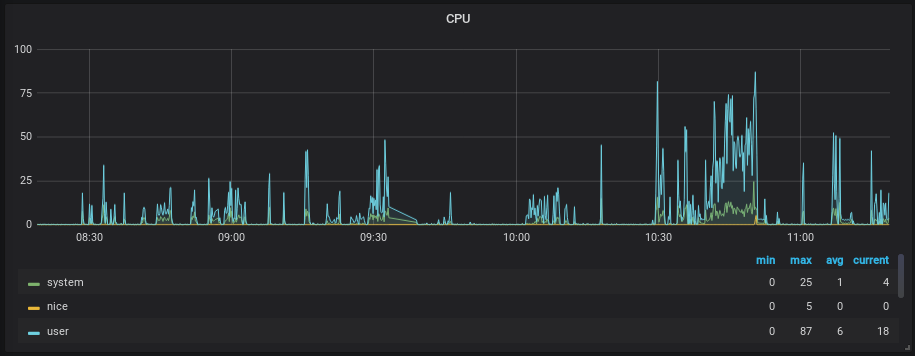
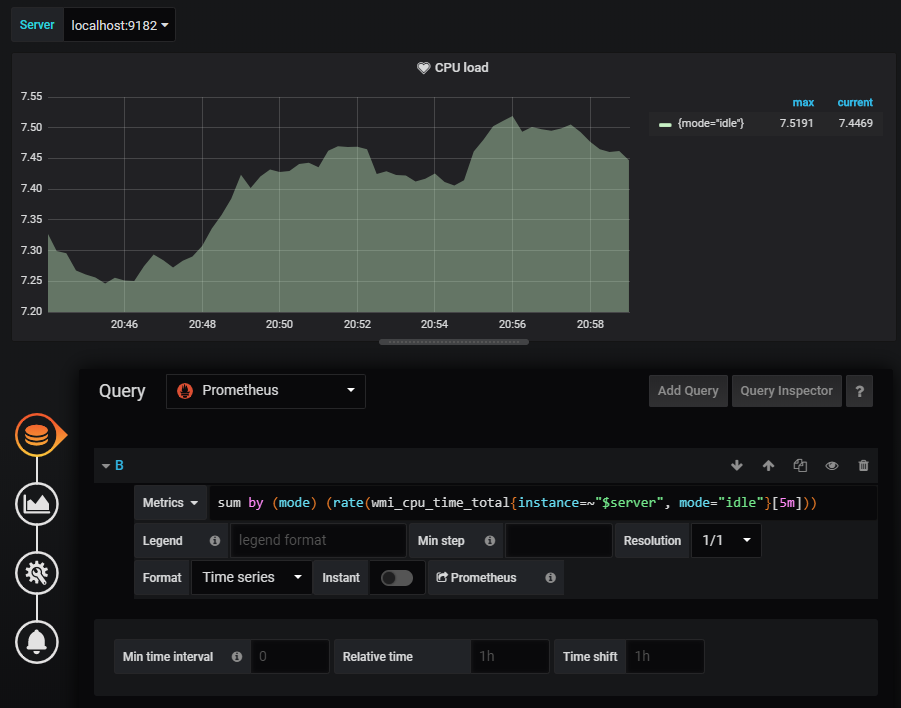
Best New Software Engineering Books To Read in 2021

Software engineering is described as a process of analyzing user requirements and then designing, building, and testing software applications to fit those requirements. Guys who are beginners, or excited to learn coding, or expert ones can check the top 10 list of the best software engineering books 2021 below:

  1. Clean Code by Robert Martins
  2. Design Patterns: Elements of Reusable Object-Oriented Software by Eric Gamma
  3. Patterns of Enterprise Application Architecture by Martin Fowler
  4. Enterprise Integration Patterns by Gregor Hohpe
  5. The Mythical Man-Month by Frederick Brooks
  6. Code Complete by Steve McConnell
  7. Git for Teams by Emma Hogbin Westby
  8. Refactoring: Improving the Design of Existing Code by Martin Fowler
  9. The Art of Unit Testing by Roy Osherove
  10. Soft Skills: The Software Developer’s Life Manual by John Sonmez

1 – Clean Code by Robert Martins

1 – Clean Code by Robert Martins cleancode-final

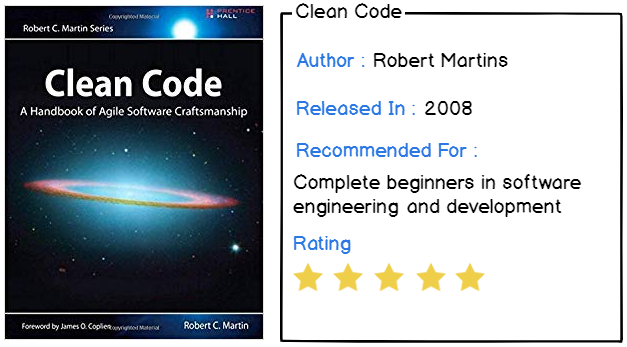
Probably one of the greatest books about software engineering and programming. Every engineer, developer, or programmer should have read this book, at least one time.

In this book, Robert Martin provides clear and concise chapters about:

  • How to write high-quality and expressive code;
  • How to name your functions, your variables, essentially conveying your intent in your coding style;
  • How to unit test properly, why it matters, and how to do it properly;
  • How to choose relevant data structures and why they can make or break a piece of code;
  • How to write comments but most importantly how NOT to write comments;
  • How error handling works and how to properly engineer an exception handling workflow through your application or program

The book also provides real-life examples written in Java, so if you are familiar with object-oriented programming, that should not be an issue at all.

This book really helps to build code maturity. It actually helps you going from “How do I technically do this” to “How do I properly technically do this?” which is most of the time a neglected point by engineers.

Oh and for those who are wondering, what did the book from the introduction become?

I gave it to an aspiring Java engineer at my current job!

This book is ideal for junior developers and young software developers or engineers.

2 – Design Patterns: Elements of Reusable Object-Oriented Software by Eric Gamma

2 – Design Patterns Elements of Reusable Object-Oriented Software by Eric Gamma

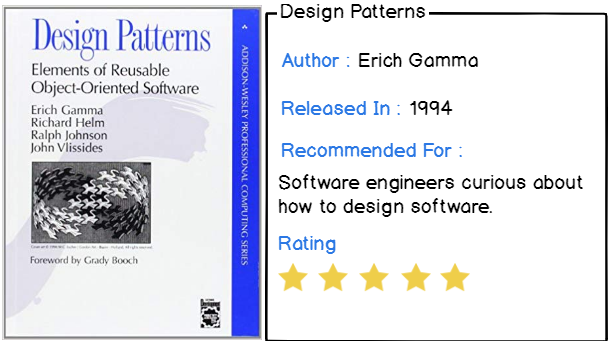
This software engineering book is a great follow-up to the Clean code manual.

As Clean Code gives you the foundations of programming, Design Patterns teaches you recipes to write manageable and scalable code.

For small or large programs, thinking about how to design it from the get-go is one of the mandatory skills of a good software engineer.

Most of the time, when designing a project, you don’t have to reinvent the wheel. You can open your design pattern book and pick one that fits your needs.

From there you have the guarantee that your project will be able to scale, and you are also given tools to scale it properly.

As examples, here are some design patterns that are taught in the book (and that I use on a daily basis)

  • Abstract Factory: that lets you abstract object creation and decouples concrete objects from the business logic where they might be used;
  • Observer: builds links between objects that allow them to be notified when a certain event occurs in one of them. Very useful for real-time applications or in industrial programs;
  • Iterator: that enables developers to iterate on objects without knowing the implementation details of those data structures.

This book is really ideal for people willing to become either senior software engineers or solution architects.

Looking to master design patterns? Here’s where to get Design Patterns by Eric Gamma

3 – Patterns of Enterprise Application Architecture by Martin Fowler

3 – Patterns of Enterprise Application Architecture by Martin Fowler

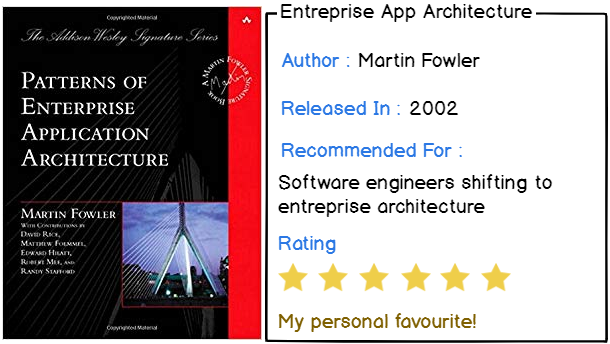
Now that you know how to code, as well as how to design your code, it is time for you to know how to structure applications on an entreprise level.

Applications grow over time, and very often, they grow to a size that no one could have predicted.

However, you need to have concepts of entreprise architecture when you are building an application.

Are you correctly layering your application? If you are building a web application, are you aware of all the different presentational designs that you can choose from?

How are you accessing your data and how are you making sure that you are efficiently decoupling data from the applications that are trying to access them?

This book helps you master those concepts, and they can really play a big role in the life of an application.

This book, among other themes, teaches the following concepts :

  • How to organize your domain and your business logic in your application;
  • Techniques on how to access data in an application and how to build solid object-relational mappings for your databases;
  • How to handle concurrency in applications and what patterns to use to avoid deadlocks;
  • Web Presentations Patterns: MVC, MVVM, templates, are all equally useful in a world dominated by Javascript front-end frameworks.
  • Data source architectural patterns: how to efficiently architecture your application depending on the data source that is residing behind it.

4 – Enterprise Integration Patterns by Gregor Hohpe

4 – Enterprise Integration Patterns by Gregor Hohpe

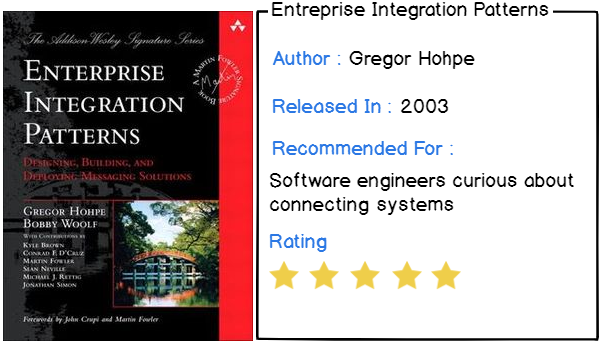
Even if you are working for startups, it is very unlikely that you will write programs as standalone tools, without any dependencies to other applications or without even communicating with them.

Applications do exchange data, they share information and they need to communicate in reliable ways.

Think about it, if you are withdrawing money at an ATM, how many different servers and databases will be contacted for every operation that you perform?

Probably a lot. And it needs to be fast and secure.

Those are the concepts taught in the book :

  • What messaging patterns are and how they help to solve issues that were described right above;
  • How to design messaging systems properly;
  • An extensive list of individual messaging components (content-based router for example) that helps you build a complete architecture tailored to your needs;
  • Real-life examples of how a banking system for example would actually be designed.

With this book, you will definitely get to know more about the capabilities of what we call an engineering architect or an entreprise architect. 

Do you even own the book? I have my very own version of it!👽

Tip: for some of my interviews, I actually got asked questions related to concepts described in this book, especially how to handle system reliability in case of failure.

Probably one of the best software engineering books when it comes to system design.

5 – The Mythical Man-Month by Frederick Brooks

5 – The Mythical Man-Month by Frederick Brooks

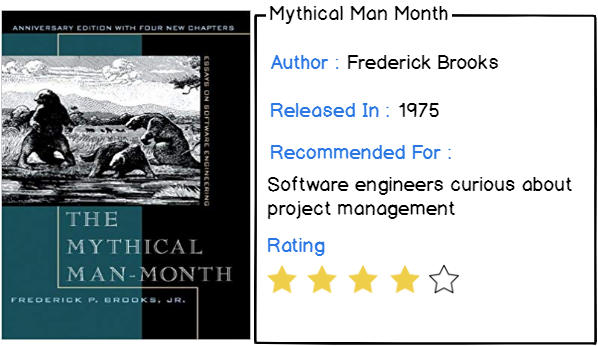
If you are following the project management path of your engineering carrier, this is probably the book you should read.

The Mythical Man-Month discusses productivity, essentially tackling one of the myths that the time taken by one engineer can be equally divided if you hire more engineers to do the job.

This is of course false, and Frederick Brooks explains several project management concepts related to this myth :

  • Silver bullet concept: stating that there are no project management techniques able to solve current inherent problems of software development;
  • How to handle delay in project delivery and what role projects owners have to endorse when it comes to their clients;
  • How to communicate efficiently as a project leader, and what your team expects from you;
  • Most importantly, how to manage project iteration and how to prevent the “second-system” effect.

In software engineering, even with the best developers, most of the project success relies on being able to manage your team efficiently.

Project management is a whole different skill set, and you are trying to succeed in this field, this is probably the book you should read.

This project management masterpiece is available right here.

6 – Code Complete by Steve McConnell

6 – Code Complete by Steve McConnell

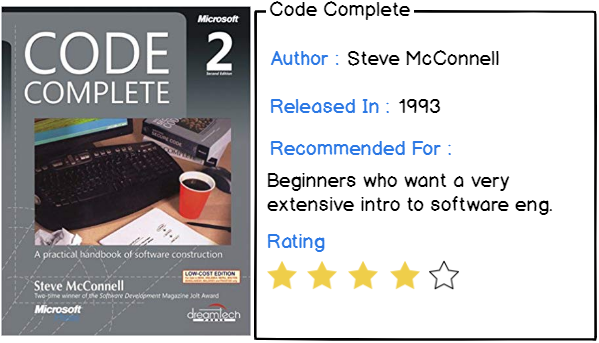
This book is seen as one of the references for software developers as it teaches all the basics that you should know in this field.

This is a very lengthy book, as it goes over 900 pages and sometimes in a lot of details.

With this book, you will cover :

  • How to code and how to debug: including how to write programs for people first, and for computers second;
  • Divide your code in terms of domains: the design of a high-level program is very different from the design (and implementation) of a low-level program;
  • Master human qualities of top coders: this is very big in an industry where everybody thinks it has the ultimate answer to a question. Build humility, curiosity, but most importantly, keep your ego in check;
  • Pick a process and stick to it: from the planning to the development, until the delivery, pick a process that guarantees project quality and prosperity.

7 – Git for Teams by Emma Hogbin Westby

7 – Git for Teams by Emma Hogbin Westby

For the seventh book, I chose a book about Git, the most used version control software in the world.

Why did I put this book in the list?

Because I believe that there can’t be a successful project without using version control, or without defining a good version control workflow.

If you are working alone, you may have not encountered issues that come with multiple people working on the same codebase at the same time.

However, without a proper workflow, the codebase can become quite a mess, and there is a very high chance that you will experience regressions.

This book teaches:

  • What git is and how to use the different commands efficiently.
  • How to define a custom git workflow for your team, given its size and what your project is about.
  • How to conduct code reviews and why they matter in software integration.
  • How to pick the best branching strategy for your team
  • How to define roles in your team, who should be a contributor, a reviewer, who manages the codebase, and so on.

Do you need a guide on how to conduct a code review? Here are the 6 best code review tips for you to know.

8 – Refactoring: Improving the Design of Existing Code by Martin Fowler

8 – Refactoring Improving the Design of Existing Code by Martin Fowler

As a software engineer, you spend a lot of time writing code and thinking about new algorithms in order to achieve your expected goal.

However, as your project grows, your codebase becomes larger and larger, you often find yourself writing duplicate functions, or having code parts that are very similar to one another.

As your project grows, you often feel like you are missing some points on function reusability and factorization. 

Refactoring by Martin Fowler is a book that helps you synthesizing and factorizing your codebase.

The book is built on study cases, focusing on seventy different refactoring cases.

On those seventy refactoring cases, Martin Fowler describes how to perform them properly, in a safe way for the code base, as well as the role of unit testing in refactoring.

9 – The Art of Unit Testing by Roy Osherove

9 – The Art of Unit Testing by Roy Osherove

A software engineering book list would not be complete without a book focused on unit testing.

Unit testing is not important, it is crucial and essential if you want to deliver a good and qualitative piece of software to the end-user.

Not every functionality or line of code has to be tested, but you have to provide a reasonable amount of unit tests for crucial parts of your codebase.

Unit tests save lives.

When your codebase is rather small, you can’t foresee the immediate benefits of having extensive unit test coverage.

However, as your codebase grows, sometimes you may want to tweak a small and harmless part of your code.

Harmless? Never. I speak from experience, even when I could swear that my modifications had no impacts on the software, in reality, they had huge impacts on existing functionalities.

The Art of Unit Testing provides core competencies on how to unit test, how to scope it, and what to unit test.

The chapters focus on :

  • What are the basics of unit testing, and how it differs from integration testing;
  • What are stubs and mocks in unit testing frameworks;
  • How to write loosely coupled unit tests in terms of dependencies;
  • Understanding isolation frameworks extensively;
  • How to work with legacy code from a testing perspective
Unit testing is crucial, and this is probably all you need to know to get your copy.

10 – Soft Skills: The Software Developer’s Life Manual by John Sonmez

10 – Soft Skills The Software Developer’s Life Manual by John Sonmez

I have followed John Sonmez from simpleprogrammer.com for a long time, and I respect John as an authoritative figure when it comes to soft skills designed for software engineers.

In a software engineering career, you spend most of your time coding, designing, and building software.

But as your responsibilities grow, you are sometimes given the opportunity to interact with clientsto gather their needs, or to actually showcase your advancement on its project delivery.

Interaction often means social skills, the ability to speak with confidence, the ability to choose the correct language given your audience, or the ability to negotiate.

Software engineering isn’t only about coding, it is also about maintaining a good work-life balance, having hobbies, exercising often, and eating properly.

Jon Sonmez helps you find and keep the right balance that you need to be an efficient and creative engineer, for a long time.

The books focus on:

  • Productivity tips: how to build the right habits for you to triple down your productivity;
  • Self-marketing tips: essentially how to sell yourself and how to increase your own perceived value;
  • Fitness tips: how working out correlates with a good and healthy software engineering career, how it can benefit you on a daily basis;
  • Financial advice: John explains how you can analyze your paycheck and make the best investments out of it.

Software engineering is not only about coding, get to know how to be more productive and have a great work-life balance.

Conclusion

Time to read and Time to practice are the best times to gain any knowledge you want.

Before ending this tutorial, there is one point that I want to make very clear when it comes to all the books.

True mastery comes from a reasonable amount of theory, and a tremendous amount of practice.

When practicing, you will get ten times more familiar with the concepts that you are reading about, and there are really no shortcuts to mastery in software engineering.

One of the greatest ways to keep learning when you are not at work, work on side projects!

Be patient, be humble, but also be confident that given the time, you will become a software engineer that delivers tools that really help people.

Experience is not taught in books. 

Until then, have fun, as always.

How To Create a Database on InfluxDB 1.7 & 2.0

How To Create a Database on InfluxDB 1.7 & 2.0

Developers who are seeking complete guide on creating a database on InfluxDB 1.7 & 2.0 can refer to this tutorial in a detailed way. In our previous tutorials, you have seen How To Install InfluxDB on Windows but now you can be familiar with database creation on both InfluxDB 1.7 & InfluxDB 2.0 versions.

Actually, InfluxDB is the famous time series databases available in the market founded on 2013 by InfluxData. It reserves millions of data points in structures known as databases.

In this tutorial, we will be explaining the different ways on How to create a database on InfluxDB 1.7 & 2.0.

influx-internalsThis tutorial includes both InfluxDB 1.7.x and InfluxDB 2.x versions because they are running at present.

up-to-date

Here is how to create a database on InfluxDB.

Creating an InfluxDB Database using the CLI

The first way and easiest way to create an InfluxDB database is through the InfluxDB CLI.

a – Launch the InfluxDB CLI

On InfluxDB 1.7.x, simply launch the influx binary.

$ influx
Connected to http://localhost:8086 version 1.7.7
InfluxDB shell version: 1.7.7

b – Verify that you have admin rights on the InfluxDB server

This step only applies if you have enabled the authentication on your InfluxDB server.

It means that you connected to the InfluxDB CLI by specifying your username and password.

To verify that you have admin rights on InfluxDB, issue the following command.

$ SHOW USERS
user    admin
----    -----
admin   true

If you are not an admin, ask your system administrator to grant you the permissions.

c – Create your InfluxDB database

The “CREATE DATABASE” command takes multiple arguments. Here is the syntax.

CREATE DATABASE <database_name> [WITH [DURATION <duration>] [REPLICATION <n>] [SHARD DURATION <duration>] [NAME <retention-policy-name>]]

The database name is a mandatory parameter, but all of the other parameters are optional.

By default, InfluxDB uses a default retention policy called autogen.

Autogen keeps data forever (infinite retention policy) and the default shard duration is 168h, or 7 days.

c – Create your InfluxDB database autogen

Knowing that here is a description of the different parameters used in the “CREATE DATABASE” command:

  • DURATION: sets the duration value of the “autogen” retention policy for the current database.
$ CREATE DATABASE "example" WITH DURATION 1h

duration-parameter

  • REPLICATION: In case you are using an InfluxDB cluster, your databases will probably be replicated among multiple different shards. The default is set to 1, but feel free to tweak this parameter if you are working with multiple different instances of InfluxDB.
  • SHARD DURATION: defines the minimum duration until your InfluxDB server starts collecting data is a new shard. It is quite important to correctly set up this parameter if you are working with your own custom retention policies.
  • NAME: the name of your database

shard-duration

Create an InfluxDB database using the InfluxDB API

Alternatively, there is another way to create an InfluxDB database which is by sending a HTTP request to the InfluxDB REST API.

a – Using cURL

If you don’t have cURL already, make sure to install it first.

$ sudo apt-get install curl
$ curl --help

Make sure that the HTTP API is enabled in the InfluxDB configuration file.

$ sudo vi /etc/influxdb/influxdb.conf

[http]
  # Determines whether HTTP endpoint is enabled.
  enabled = true
  
  # The bind address used by the HTTP service.
  bind-address = ":8086"

Restart your InfluxDB server is necessary, and create your database via the /query endpoint.

$ sudo systemctl restart influxdb
$ curl -XPOST 'http://localhost:8086/query' --data-urlencode 'q=CREATE DATABASE "devconnected"'

{"results":[{"statement_id":0}]}

If you are using authentication, you need to specify the user password combination.

$ curl --user admin:password -XPOST 'http://localhost:8086/query' --data-urlencode 'q=CREATE DATABASE "devconnected"'

{"results":[{"statement_id":0}]}

If you are using InfluxDB with HTTPS on self-signed certificates, you need the cURL -k option for unsafe checks.

$ curl --user admin:password -k -XPOST 'http://localhost:8086/query' --data-urlencode 'q=CREATE DATABASE "devconnected"'

{"results":[{"statement_id":0}]}

Verify that your database is correctly created via the InfluxDB CLI.

$ influx
Connected to http://localhost:8086 version 1.7.7
InfluxDB shell version: 1.7.7

> SHOW DATABASES
name: databases
name
----
_internal
devconnected
Great! You have successfully created a database on InfluxDB!

If you prefer to use Postman, here’s how to do it.

b – Using Postman

For this tutorial, let’s assume that you already have Postman installed on your computer.

First, unblock the “SSL Certificate Verification” option on Postman.

Head over to Settings > General, and uncheck the SSL verification option.

b – Using Postman ssl-verification

Create a POST request to the /query endpoint.

In the body panel, select the “x-www-form-urlencoded” option, and put the following values.

arguments-postman

In the Authorization panel, select a “Basic Auth” option, and fill the following fields with the correct credentials.

auth-postman

Click on “Send” and verify that you are getting the correct HTTP response.

results-postman

Check again on the InfluxDB server that the database was correctly created.

$ influx
Connected to http://localhost:8086 version 1.7.7
InfluxDB shell version: 1.7.7

> SHOW DATABASES
name: databases
name
----
_internal
devconnected
postman

Great! You have successfully created an InfluxDB database from Postman.

Create a Database using InfluxDB clients

In order to interact with the InfluxDB HTTP API, developers have created multiple clients in different languages: Java, Javascript, Go, .NET, Perl, and many others.

Using those clients is another way to create an InfluxDB database (if the developers exposed a method for it of course)

a – Creating a database in Java

As an example, the influxdb-java library allows you to create an InfluxDB database very easily.

In your Java project, import the influxdb-java package into your pom file.

<dependency>
    <groupId>org.influxdb</groupId>
    <artifactId>influxdb-java</artifactId>
    <version>2.15</version>
</dependency>

Next, connect to your InfluxDB instance, and create a database.

InfluxDB influxDB = InfluxDBFactory.connect("http://localhost:8086", "admin", "password");

influxDB.createDatabase("java-database");
influxDB.createRetentionPolicy(
  "one-year", "java-database", "365d", 1, true);

Again, make sure that your database was created successfully using the InfluxDB CLI.

$ influx
Connected to http://localhost:8086 version 1.7.7
InfluxDB shell version: 1.7.7

> SHOW DATABASES
name: databases
name
----
_internal
java-database
Awesome, you created an InfluxDB database using a Java client library.

b – Create a database in Javascript / NodeJS

As a second example, let’s see how you can create an InfluxDB database using Javascript and the Node runtime.

For this, we are going to use the node-influx library available on Github (developed by Ben Evans and Connor Peet)

First, install the node module in your project.

$ npm install --save influx

Database creation is done by using the createDatabase method available in the API.

const Influx = require('influx');
const influx = new Influx.InfluxDB({
  host: 'localhost',
  port: 8086,
  username: 'admin',
  password: 'password'
})

// Create an InfluxDB database
influx.createDatabase('node-database')

Did you know? This is the library that I used to design Stream Highlights, a real-time highlights detection platform for Twitch.

Finally, make sure that your database was successfully created.

$ influx
Connected to http://localhost:8086 version 1.7.7
InfluxDB shell version: 1.7.7

> SHOW DATABASES
name: databases
name
----
_internal
node-database

Create a database with the InfluxDB 2.0 CLI

At the beginning of the year, InfluxDB 2.0 was announced in alpha and the product is now actively developed.

Instead of having four different tools, also known as the TICK (Telegraf, InfluxDB, Chronograf, Kapacitor) stack, InfluxDB 2.0 will be one single platform for you to perform all your tasks.

In InfluxDB 2.0, databases no longer exist, they are replaced by buckets.

Conceptually, buckets are pretty much like databases, but we will need different commands to create them.

a – Get a secure token

If you try to execute a command with the Influx CLI without being authorized, you will get the following message.

a – Get a secure token unauthorized

On InfluxDB 2.0, you have to specify a token when performing a request.

Head over to your InfluxDB 2.0 platform located at http://localhost:9999 by default.

Click on “Settings

settings-influx-2

Then click on the “Tokens” option.

tokens-1

If a token already exists, simply click on it, and copy the token shown in the popup window.

a – Get a secure token token

Make sure that your token has at least the “read” permission for the “orgs” section, and the “write” for the “buckets” section.

a – Get a secure token rights-influxdb-2

If your token doesn’t exist already, you can generate one by clicking on the “Generate” option located at the top-right corner of the window.

generate-token

Click on “All Access Token”, give a name to your token, and you are ready to go!

create-token

b – Get your organization ID

In order to create a bucket, you will need your organization ID.

To find your organization ID, execute the following command.

$ influx org find -t yoursecrettoken
ID                     Name
044dc0bcf1860000       devconnected

c – Create your bucket

Now that you have your organization ID, you can create your bucket.

Here’s the command :

$ influx bucket create -n bucketname --org-id 044dc0bcf1860000 -r 10h -t yoursecrettoken

In this command, multiple flags are specified:

  • -n: the name of the bucket
  • –org-id: the organization ID (that you previously grabbed)
  • -r: the bucket retention time in nanoseconds
  • -t: the secret token

c – Create your bucket bucket-created

Make sure that your bucket was correctly created with the following command.

$ influx bucket find -t yoursecrettoken

Create a database using the InfluxDB 2.0 UI

If you prefer clicking buttons to running commands in a terminal, this method is for you.

Click on “Settings” > “Bucket”

V – Create a database using the InfluxDB 2.0 UI

Click on the “Create bucket” option at the top-right corner of the window.

create-bucket-2

Give a name to your bucket, and define a retention policy for it. I chose 10 hours in the previous example.

Simply click on “Create” to end the creation process.

Awesome, your bucket has been created!

2-buckets

Conclusion

In this tutorial, we have discussed various ways to create an InfluxDB database or bucket based on the version that you are using.

If you want more details about InfluxDB, make sure to read the definitive guide to InfluxDB.

Concepts detailed are for InfluxDB 1.7.x, but most of them still apply if you are using InfluxDB 2.0.

If you need more practical tutorials, here’s how you can monitor SSH hackers on a Linux server using InfluxDB.

Until then, have fun, as always.

How To Check SSL Certificate Expiration with Grafana

How To Check SSL Certificate Expiration with Grafana | Grafana SSL Certificate Expiry Check

In this tutorial, we are going to discuss How To Check SSL Certificate Expiration with Grafana. Security is more important these days so you have to secure various parts with SSL Certificates while setting up the entire monitoring solutions.

In our previous Prometheus setup on Linux also we have created SSL certificates to ensure the interaction between those agents and grafana was protected.

Also Check: MongoDB Monitoring with Grafana & Prometheus

As time passes, it is common to verify SSL certification expiration and secure the visualizing data. Let’s assume that one of the SSL certificate expiration dates is about to expire. Now, we have to check the ways to secure it.

In today’s guide, we are explaining the simple process to monitor SSL certificate expiration dates with Grafana and Prometheus.

Get Ready?

What You Will Learn?

Those are the concepts that you are going to learn if you follow this tutorial until the end.

  • How to setup Prometheus and Grafana easily
  • How to install the node-cert exporter to monitor your SSL certificates.
  • How to design a Grafana dashboard to visualize SSL certificate expirations.
  • How to raise alerts when your SSL certificates are about to expire.

That’s a long program, let’s start working.

Installing Prometheus & Grafana

The complete Prometheus & Grafana installation has already been covered in one of our previous articles.

It explains how to setup your Prometheus monitoring instance, how to secure it using HTTPS, and how to bind it securely to Grafana.

You can skip the reverse proxy steps, but it is highly recommended to setup an NGINX reverse proxy for safety purposes.

When you are done, you are ready to go to step two.

Do Check: Complete MySQL dashboard with Grafana & Prometheus

Installing the node-cert exporter in Prometheus

Now that our Prometheus & Grafana stack is ready, it is time to install the node-cert exporter.

The node-cert exporter is an exporter that will periodically check your SSL certificates given a set of filesystem paths.

It is highly recommended to store your SSL certificates in the /etc/ssl folder, but you may store them in different places.

a – Download the node-cert exporter

To download the node-cert exporter, run a simple wget command.

$ wget https://github.com/amimof/node-cert-exporter/releases/latest/download/node-cert-exporter-linux-amd64

You should now have the node-cert-exporter executable on your instance.

Move this executable to your /usr/local/bin folder and make it executable, at least for the owner of the file.

$ sudo mv node-cert-exporter-linux-amd64 /usr/local/bin
$ sudo chmod u+x /usr/local/bin/node-cert-exporter-linux-amd64

Create a user for the node-cert exporter.

$ sudo useradd -rs /bin/false node-cert-exporter

Make the node-cert-exporter user the owner of the exporter executable.

$ sudo chown node-cert-exporter:node-cert-exporter /usr/local/bin/node-cert-exporter-linux-amd64

This should be the content of your bin folder.
Node Cert Exporter archive

b – Install the node-cert exporter as a service

As always, we are going to install the exporter as a service.

Running exporters as a background process is the best way to crash them. Plus, you can monitor your systemd services and be notified when one goes down.

As always, head to the /lib/systemd/system folder, and create a node-cert service file in there.

$ cd /lib/systemd/system
$ sudo touch node-cert-exporter.service

The node-cert exporter uses the path flag to specify where your certificates are located on your system.

In my case, I am going to suppose that my certificates are located in the /etc/ssl/certs folder.

Make sure to finetune the path flag for your own SSL path.

Here is the content of the service file.

[Unit]
Description=Node Cert Exporter
Wants=network-online.target
After=network-online.target

[Service]
Type=simple
User=node-cert-exporter
Group=node-cert-exporter
ExecStart=/usr/local/bin/node-cert-exporter-linux-amd64 \
    --path=/etc/ssl/certs

Restart=always

[Install]
WantedBy=multi-user.target

Enable your service, and start it.

$ sudo systemctl enable node-cert-exporter
$ sudo systemctl start node-cert-exporter

enable-service

Great!

Let’s have a look at the metrics exposed by the node-cert exporter.

$ sudo lsof | grep LISTEN | grep node-cert

node-cert

Given the information of the last column, we can see that the node-cert exposes metrics on the port 9117.

Let’s do a quick curl command to see if it is aggregating metrics correctly.

$ curl http://localhost:9117/metrics

If you are seeing metrics named “ssl_certificate_expiry_date“, congratulations!

Your node-cert exporter is correctly installed.

ssl_cert_expiry

c – Binding your exporter to Prometheus

Now that your node-cert exporter is correctly running, you need to bind it to Prometheus.

To do so, navigate to your Prometheus configuration file, and start editing it to add the following targets.

$ cd /etc/Prometheus
$ sudo vi prometheus.yml

In the static_configs part of your configuration file, add a new entry for the cert exporter.

static_configs:
            - targets: ['localhost:9090', 'localhost:9117']

Restart Prometheus for your changes to be applied.

$ sudo systemctl restart prometheus

Don’t forget to verify that Prometheus is actively scraping your new target.

Head over to http://localhost:1234/targets (if you followed the Prometheus and Grafana tutorial).

targets-prom

Awesome! The exporter is up and running.

Time to check the SSL certificate expirations in Grafana.

Creating a Grafana dashboard

In order to visualize SSL certification expiration dates, we are going to use a predefined dashboard built by the creator of the exporter.

a – Import a Grafana dashboard

To import a Grafana dashboard, click on the Import option available in the left menu.

import-dash

In the next window, choose to import your dashboard given a dashboard ID.

The dashboard ID for the node-cert dashboard is 9999.

In the next window, choose to import your dashboard given a dashboard ID.

From there, Grafana should automatically detect that you are trying to import the dashboard.

This is what you should see.

import-dash-2

b – Write a PromQL query for SSL certificate expiration

By default, the dashboard is not fully loaded in Grafana.

For some reasons that I ignore, the PromQL query is not actively loaded. That’s not a big problem, we are going to write it our way.

Edit the table panel in your dashboard.

edit-panel

Go to the query panel, select Prometheus as a datasource and write the following PromQL query.

promql-query

Important Note: Do not forget to check the “Instant” option on the second line of your query panel (otherwise you won’t be able to see anything)

This is what you should now see on your dashboard.

final-dashboard-1

Awesome!

You now have a dashboard checking your SSL certificates with pleasing colors.

As you can see, most of my certificates are safe, but some of them will have to be renewed in a month or so.

c – Customizing the threshold levels

As you can see, some thresholds are already defined in this Grafana dashboard.

By default, red lines will be displayed for SSL certificates that need to be renewed in less than three monthsorange lines between three months and six months, and green lines for more than six months.

Would you like to customize those levels?

Let’s have red lines for expirations in less than one week, and orange between one week and one month.

To customize it, head over to the “Visualization” panel in Grafana and search for the corresponding option line.

visu-panel

The levels are stored in the “Thresholds” text field.

The current values are 7889231 seconds (3 months) and 15778463 seconds (6 months).

Let’s modify this text field for 2592000 (1 month) and 25920000 (10 months).

604800,2592000

orange-levels

Firing alerts when SSL certificates expire

If you are to check your SSL certification expiration dates, it is very likely that you are not going to take a look at your dashboard every day.

You want to be alerted when one of your certificates is about to expire.

Make sure to install the AlertManager with Prometheus by following this tutorial.

a – Creating a rules file

In your Prometheus folder, create a “alerts” folder. This is the place where you are going to store all your alert files.

Go to your alerts folder, and create a new file named “ssl_rules.yml“.

$ cd /etc/prometheus
$ sudo mkdir alerts && cd alerts
$ sudo nano ssl_rules.yml

In the file, paste the following content.

groups: 
  - name: ssl_expiry.rules 
    rules: 
      - alert: SSLCertExpiringSoon 
        expr: sum(ssl_certificate_expiry_seconds{}) by (instance, path) < 86400 * 30 
        for: 10m

The following configuration will fire an alert when you need to check your SSL certificate (one month away from being expired)

As a reminder, the Prometheus server is going to be used as a client for the Alert Manager.

b – Create an AlertManager rules file

Now we are going to create a rules file for the AlertManager.

For this part, we are going to use Slack as a recipient, but you could send an email, or use PagerDuty for example.

If you are looking to create a Webhook for Slack and Prometheus, check our other articles or go for a web search.

Go to your /etc/alertmanager folder and create a new file named “alertmanager.yml“.

$ cd /etc/alertmanager
$ sudo touch alertmanager.yml

Paste the following content in your file (change the webhook URL for the one provided by your Slack workspace)

global:
  resolve_timeout: 5m

route:
 group_by: ['SSLCertExpiringSoon']
 group_wait: 10s
 group_interval: 10s
 repeat_interval: 1h
 receiver: slack
 

receivers:
- name: slack
  slack_configs:
  - api_url: $WEBHOOK_URL
    channel: '#devconnecteds-blog'

Save your file, and make sure that your AlertManager service is launched with the correct option (with the correct –config flag)

alertmanager-service-1

Restart your AlertManager service.

$ sudo systemctl restart alertmanager

c – Getting AlertManager alerts on Slack

Now that our configuration is set, it is time to have an alert firing on the Prometheus server.

As you can see, two alerts are already firing on my Prometheus alerts tab.

alerts-prom

On the AlertManager, this is what you should see.

alerts-am

Finally, you should receive your alerts on Slack. In this case, they are grouped, but you can modify this option in your rules file (by replacing the group by option).

alerts-slack

Awesome! You are now notified when you have to check your SSL certificates.

Alternatives

Alternatives to Prometheus and Grafana exist to check your SSL certificate expiration.

David McKay, the developer advocate for InfluxData, wrote an article on how to check your SSL certificates using Telegraf and InfluxDB.

This is more or less the same principle, except that you would have to use an InfluxDB datasource in Grafana.

If you are not sure about how to setup the TIG stack, here is how to setup InfluxDB and Grafana on Linux.

Free services also exist if you are looking to monitor your SSL certificates online. Certificate Expiry Monitor is one of them as an example. Are you going to start using Prometheus to monitor your SSL certificates?

I hope that you learned something new today. Till next practice well with our useful tutorials on modern technologies.

How To Install Prometheus with Docker on Ubuntu 18.04

How To Install Prometheus with Docker on Ubuntu 18.04

Guys do you know what is Prometheus & Docker? If not, then stay tuned to this guide. As it comes with detailed information about both along with the How To Install Prometheus with Docker on Ubuntu 18.04

Prometheus is an open-source monitoring system and time series database used in DevOps for real-time monitoring founded in 2012 at SoundCloud. Whereas, Docker provides a space for you to encapsulate server processes with Linux containers (or other encapsulation technologies) thus why they are more efficiently managed and isolated from each other.

If you hold the professions like system administrator or a site reliability engineer, then you are apparently seeking to set up reliable monitoring architectures. One of the techniques to accomplish it is to set up Prometheus in a Docker container.

By following this approach you can test it easily on your local system and make sure that it will perform the same when deploying it on a remote server. The tutorial that we have come up with is to install Prometheus with Docker in addition to setting up a basic configuration for Prometheus.

Moreover, we are also explaining how to install the Node Exporter to meet metrics from your local Linux host.

Prerequisites

In order to install Prometheus on Docker, you will need to have sudo rights on your host.

If you are not sure about it, run the following command

$ sudo -v

Installing Docker on Ubuntu

Before installing Prometheus on Docker, it is important that Docker is already correctly installed and configured on your instance.

If you need a complete Docker installation for Ubuntu, there is a guide on devconnected about it.

Before moving to the next section, make sure that you have the latest version of Docker running.

$ docker --version
Docker version 19.03.1, build 74b1e89

Now that your Docker is ready, let’s install the Prometheus container.

Before that, you can also check out our other docker installation tutorials from the below quick links:

Installing Prometheus on Docker

The official Prometheus image for Docker is named: prom/Prometheus.

The “prom” community organization is also editing Docker images for all the components of the Prometheus stack: alert manager, node exporter, MySQL exporter, or the Pushgateway.

The Prometheus Docker image is going to install the Prometheus server. It is the one responsible for aggregating and storing time-series metrics.

The configuration files and the data directories are going to be stored on the local host filesystem.

As a consequence, those folders will be mapped into the Docker container to ensure data persistence. It is also easier to modify files on the local filesystem rather than in a container.

a – Prepare Prometheus for Docker

Likewise to the way we have installed Prometheus and Grafana on Linux, create a user for Prometheus on your system if not already existing.

$ sudo useradd -rs /bin/false prometheus

In your etc directory, create a new folder and a new configuration file for Prometheus.

$ sudo mkdir /etc/prometheus
$ cd /etc/prometheus/ && sudo touch prometheus.yml

Similarly, create a data folder for Prometheus.

$ sudo mkdir -p /data/prometheus

Make sure that the permissions are correctly set for the configuration file and for the data folder.

$ sudo chown prometheus:prometheus /data/prometheus /etc/prometheus/*

This way, only the Prometheus and root can modify this file. This provides greater security to our Prometheus setup.

b – Configure Prometheus for Docker

This step consists of filling up the configuration file that we have created recently. Head over to your configuration folder, and start editing the file.

$ vi /etc/prometheus/prometheus.yml

Paste the following configuration in your file.

# A scrape configuration scraping a Node Exporter and the Prometheus server
# itself.
scrape_configs:
  # Scrape Prometheus itself every 10 seconds.
  - job_name: 'prometheus'
    scrape_interval: 10s
    target_groups:
      - targets: ['localhost:9090']

For now, Prometheus is only going to monitor itself.

Later on, we are going to add the Node Exporter that will be responsible for gathering metrics from our local Linux system.

Now that Prometheus is configured for Docker, we are going to run the Prometheus container.

c – Running the Prometheus Docker container

We are going to use the image from the Prometheus image from the prom repository.

As a reminder, to start a Docker container, you have to use the docker container run command.

Make sure that nothing is running on port 9090 already.

$ sudo netstat -tulpn | grep 9090

As we configured our folders to be accessible by the Prometheus user, you will have to determine the ID for this user.

To find the Prometheus user ID, head over the passwd file and run

cat /etc/passwd | grep prometheus
prometheus:x:996:996:/home/prometheus:/bin/false

As you can see, the Prometheus user ID is 996. This is what we are going to use to create our Prometheus container.

Note: The user ID might be different on your instance. If it is the case, modify the –user parameter in the command below.

To start Prometheus on Docker, run the following command.

docker run -d -p 9090:9090 --user 996:996 \ 
--net=host \
-v /etc/prometheus/prometheus.yml \ 
-v /data/prometheus \ 
prom/prometheus \ 
--config.file="/etc/prometheus/prometheus.yml" \ 
--storage.tsdb.path="/data/prometheus"

Here is an explanation of all the parameters provided in this command.

  • -d: stands for detached mode. The container will run in the background. You can have a shell to run commands in the container, but quitting it won’t stop the container.
  • -p: stands for the port. As containers are running in their own environments, they also have their own virtual networks. As a consequence, you have to bind your local port to the “virtual port” of Docker (here 9090)
  • -v: stands for volume. This is related to “volume mapping” which consists of mapping directories or files on your local system to directories in the container.
  • –config.file: the configuration file to be used by the Prometheus Docker container.
  • –storage.tsdb.path: the location where Prometheus is going to store data (i.e the time series stored).
  • –net: we want the Prometheus Docker container to share to the same network as the host. This way, we can configure exporters in individual containers and expose them to the Prometheus Docker container.

To make sure that everything is running properly, list the running containers on your instance.

$ docker container ls -a
CONTAINER ID        IMAGE               COMMAND                         CREATED              STATUS              PORTS                        NAMES
gfre156415ea78      prom/prometheus     "/bin/prometheus --con.."       About a minute ago   Up 
0.0.0.0:9090 ->9090/tcp      modest_hypatia

As you can see, my container is up and running.

Want an interactive shell running to access your Prometheus Docker?

docker exec -it <container_id> /bin/sh

If your container is not running, it is probably marked as “Exiting” in the status column. If this is the case, here is a command to inspect what happened during the initialization of the container.

$ docker container logs -f --since 10m <container_id>
8/29/2019 @ 11:11:00 - Port already in use : 9090

This command is very handy when something wrong happens on your container.

However, if your container is up, you should have access to the Prometheus Web UI, located by default at.

prometheus-web-u

As Prometheus is already scrapping itself, you should see it as a target in the “Status > Targets” panel.

targets-prom-2

Congratulations, you successfully installed Prometheus on Docker.

However, Prometheus alone isn’t very useful. As a consequence, we are going to install the Node exporter: an exporter responsible for gathering and aggregating metrics related to Linux system performance.

Installing the Node Exporter on Docker

The Node exporter also comes with its own Docker image.

Similar to what we did with the Prometheus Docker image, let’s create a user for the Node Exporter.

a – Prepare the Node Exporter for Docker

$ $ sudo useradd -rs /bin/false node_exporter

Again, to launch the container properly, you will have to get the Node Exporter user ID. To do it, run

$ cat /etc/passwd | grep node_exporter
prometheus:x:995:995:/home/node_exporter:/bin/false

b – Running the Node Exporter Docker image

The Node Exporter does not have a dedicated configuration file.

Instead, it relies on the flag provided to the command line to enable or disable collectors. By default, a lot of them are enabled by default (you can find the list here) but some of them are not.

To enable them, you will have to provide a –collector.<name> flag to the command line.

Before running the node exporter image, make sure that nothing is running on port 9100 (the default Node Exporter port).

$ sudo netstat -tulpn | grep 9100

You will have to map certain directories on your filesystem to the Node Exporter image.

Indeed, if you don’t map the correct folders, you are going to monitor the filesystem of your Docker image, which is not what we want in this case.

To run the Node Exporter image, run the following command

docker run -d -p 9100:9100 --user 995:995 \
-v "/:/hostfs" \
--net="host" \
prom/node-exporter \
--path.rootfs=/hostfs

Here are the details of the flags provided to this command.

  • -d: detached mode, will run the node exporter even if we are not directly interacting with it;
  • -p: as the node exporter runs on port 9100, we are going to expose this port to Prometheus;
  • –user: the node exporter user ID, for security purposes.
  • -v: the host filesystem (the machine you are monitoring) is mapped to a folder in the Docker image.
  • –net: sets the Docker image and the host to share the same network.
  • –path.rootfs: instructs the node exporter to look for the filesystem in the hostfs folder. This way, the Node exporter is not monitoring your Docker filesystem, but the mapped filesystem from your host.

c – Verify that the Node exporter is running

To verify that the Node exporter is running, make a simple curl call on your host.

$ curl http://localhost:9100/metrics

node_scrape_collector_success{collector="arp"} 1
node_scrape_collector_success{collector="bcache"} 1
node_scrape_collector_success{collector="bonding"} 1
node_scrape_collector_success{collector="conntrack"} 1
node_scrape_collector_success{collector="cpu"} 1
...

Great! It seems that the Node Exporter is running correctly. Make sure that the Node exporter is actually scrapping your host and not the Docker image.

$ curl http://localhost:9100/metrics | grep uname

node_uname_info{domainname="(none)",machine="x86_64",nodename="schkn-debian",release="4.15.0-42-generic",sysname="Linux",version="#45-Ubuntu SMP Thu Nov 15 19:32:57 UTC 2018"} 1

As you can see, the nodename is correct and the version is also correct. The Node exporter is correctly scrapping my host, and not the Docker container itself.

d – Bind Prometheus to the Node Exporter

Now that the Node Exporter and Prometheus are running separately, it is time to bind Prometheus to the Node Exporter to start storing our metrics.

Head over to your Prometheus configuration file, and append the following changes.

# A scrape configuration scraping a Node Exporter and the Prometheus server
# itself.
scrape_configs:
  # Scrape Prometheus itself every 10 seconds.
  - job_name: 'prometheus'
    scrape_interval: 10s
    target_groups:
      - targets: ['localhost:9090']

  - job_name: 'node_exporter'
    scrape_interval: 10s
    target_groups:
      - targets: ['localhost:9100']

Make sure that you create a new scrape configuration for the node exporter. This way, metrics are going to be correctly labeled and they will be easily retrievable.

There is no need to restart the Prometheus Docker container for the modifications to be applied.

To restart your Prometheus configuration, simply send a SIGHUP signal to your Prometheus process.

First, identify the PID of your Prometheus server.

$ ps aux | grep prometheus
schkn  4431  0.0  0.0  14856  1136 pts/0    S+   09:34   0:00 /bin/prometheus --config.file=...

The PID of my Prometheus process is 4431. Send a SIGHUP signal to this process for the configuration to restart.

$ sudo kill -HUP 4431

Now, your Prometheus instance should have the Node Exporter as a target. To verify it, head over to http://localhost:9090 and verify that it is the case.

node-exporter-target-docker

As you can see, the node exporter target is up and running.

Now that your system is monitored using Prometheus and the Node Exporter through Docker, let’s have a quick Grafana installation to visualize our metrics.

Installing Grafana on Docker

Installing Grafana on Docker is pretty straightforward. Here is the command to get it.

a – Getting the Grafana image

$ docker run -d -p 3000:3000 --net=host grafana/grafana

Note: Do not forget the net option, otherwise your Grafana instance is not going to find your Prometheus instance running on your host.

If your Docker image cache doesn’t have the Grafana image, it is going to retrieve it, store it, and create a Grafana docker on your host.

When the installation is done, head over to http://localhost:3000 (the default port for Grafana)

grafana-default

By default, the credentials are admin for the username and admin for the password.

By clicking on “Log In”, you are asked to change the default password. Choose a strong one, and click on “Save“.

grafana-change-pass

b – Add Prometheus as a Datasource

By default, you will be redirected to the Homepage. Click on the “Add a Datasource” option.

home

Choose a Prometheus Datasource and click on “Select

prometheus-datasource-1

Here is the configuration for your Prometheus host.

datasource-prometheus

Click on “Save and Test” and make sure that your Prometheus configuration is running properly.

save-test

c – Import the Node Exporter dashboard

As the Node exporter is quite a popular exporter, there are developers who already created dashboards for it.

As a consequence, we are going to install the Node Exporter dashboard on Prometheus.

In the left menu, click on the “Plus” icon, then “Import”.

import

In the Grafana dashboard text box, type 1860 and wait for Grafana to retrieve the dashboard information automatically.

dashboard-import

In the next window, select Prometheus as a datasource and click on “Import“.

import-2

That’s it! Your dashboard should now automatically be created.

final-dash

Going Further

As you can see, installing Prometheus on Docker is pretty simple. Because we have covered the installation process along with how to install a simple exporter and dashboard monitoring solution which is Grafana in this case.

This is a basic yet very effective setup for your monitoring architecture. If you are looking for more Docker tutorials, then go through this website completely. I hope that you learned something new today. Until then, have fun, as always.

How To Install and Configure Blackbox Exporter for Prometheus

How To Install and Configure Blackbox Exporter for Prometheus?

Whenever you are working with Prometheus, you must be familiar with How To Install and Configure Blackbox Exporter for Prometheus as it helps to monitor the endpoints with ease.

In case you are working as a network engineer then you should resolve DNS response times to diagnose network latency issues. In order to fix the problems, you need to have comprehensive monitoring of your ICMP requests to collect more data regarding network health.

Today’s tutorial is completely about the installation and configuration of the Blackbox exporter with Prometheus also you can take a look at the basic information like what is a Blackbox exporter? Monitoring with blackbox exporter, etc.

Let’s be ready with prerequisites and start installing & configuring the Blackbox Exporter with Prometheus?

What You Are Going To Learn?

By following this tutorial until the end, here are the concepts that you are going to learn about.

  • How to install Prometheus securely using authentication and TLS encryption;
  • What is the Blackbox exporter and how it differs from application instrumenting;
  • How to install the Blackbox exporter as a service;
  • How to bind the Blackbox exporter with Prometheus;
  • How to monitor your first HTTP endpoint.

That’s quite a long program, let’s head to it.

Also Check: Windows Server Monitoring using Prometheus and WMI Exporter

Installing Prometheus Securely

Firstly, have a look at our previous tutorial ie., how to install Prometheus on Linux operating systems, and then start following this guide carefully, your Prometheus server is currently sitting behind a reverse proxy with authentication enabled.

In this tutorial, we are going to use the https://localhost:1234 URL in order to reach Prometheus with the Blackbox exporter.

However, if you configured Prometheus on another URL, you will need to change the configuration options provided in this tutorial.

What is the Blackbox exporter with Prometheus?

The Blackbox exporter is a probing exporter or a tool that allows engineers to monitor such as HTTP, HTTPS, DNS, ICMP, or TCP endpoints.

By using the BlackBox exporter, we are able to scrape the details of all the endpoints on the target examples with details like response time, Status code, SSL certificate expiry, and DNS lookup latencies.

a – Blackbox general concepts

The Blackbox exporter provides metrics about HTTP latenciesDNS lookups latencies as well as statistics about SSL certificates expiration.

The Blackbox exporter is mainly used to measure response times.

As a consequence, if you are looking for more detailed metrics for your application (for example a Python application), you will have to instrument your application.

It is noteworthy to say that the Blackbox exporter can be bound with the AlertManager and Prometheus in order to have detailed alerts when one endpoint goes down.

When running, the Blackbox exporter is going to expose an HTTP endpoint that can be used in order to monitor targets over the network. By default, the Blackbox exporter exposes the /probe endpoint that is used to retrieve those metrics.

For example, if my Blackbox exporter is running on port 9115, and if I query metrics for google.com, this is the endpoint that I can query from the exporter.

$ http://localhost:9115/probe?target=https://google.com&module=https_2xx

example-1
As you probably understand, the Blackbox exporter is a standalone tool, it does not need any other tools to run.

On the other hand, Prometheus binds to the exporter. You are going to define ‘targets’ in a dedicated Blackbox configuration section, and Prometheus will issue requests to the probe endpoint we saw earlier.

Prometheus is acting as a way to automate requests and as a way to store them for long-term storage.

b – What are the Blackbox modules?

As with most of the Prometheus ecosystem tools, the BlackBox exporter is configured with a YAML configuration file.

The Blackbox exporter configuration file is made of modules.

A module can be seen as one probing configuration for the Blackbox exporter.

As a consequence, if you choose to have an HTTP prober checking for successful HTTPS responses (2xx HTTP codes for example), the configuration will be summarized within the same module.

The documentation for modules is available here. As you can see, you have many options for all the probers that are available to you.

Monitoring endpoint’s availability is either a success or a failure.

As a consequence, the Blackbox exporter will report if it successfully probed the targets it was assigned (0 for a failure and 1 for success).

Given the value of the probing, you can choose to define alerts in order to be notified (on Slack for example) when an endpoint goes down.

c – How does the Blackbox exporter differ from application instrumenting?

As a reminder, application instrumenting means that you are adding client libraries to an application in order to expose metrics to Prometheus.

Client libraries are available for most programming languages and frameworks such as Go, Python, Java, Javascript, or Ruby.

The main difference between the Blackbox exporter and application instrumenting is that the Blackbox exporter only focuses on availability while instrumentations can go more into details about the performance.

With instrumentation, you can choose to monitor the performance of a single SQL query for example, or a single server function.

The Blackbox exporter will not be able to expose this granularity, only a request failure or a request success.

Now that you have some concepts about the Blackbox exporter, let’s start installing it as a service on our host.

Installing the Blackbox exporter for Prometheus

First of all, you are going to download the latest version of the Blackbox exporter available for Prometheus.

a – Downloading the Blackbox exporter

To download the Blackbox exporter, head over to the Prometheus downloads page.

Filter your results by choosing Linux as the current operating system.

linux-filter

Scroll down a bit, and find the blackbox exporter executable, right below the AlertManager section.

blackbox

As you can see, at the time of this tutorial, the Blackbox exporter is available on the 0.14.0 version.

Click on the archive to download it. If you are more familiar with wget, copy the link and run this command.

$ wget https://github.com/prometheus/blackbox_exporter/releases/download/v0.14.0/blackbox_exporter-0.14.0.linux-amd64.tar.gz

The archive should be correctly downloaded on your host. To extract the archive, run the following command

$ tar xvzf blackbox_exporter-0.14.0.linux-amd64.tar.gz

extract-archive

Besides the license and the notice files, the archive contains two important files:

  • blackbox_exporter: the executable for the Blackbox exporter. This is the executable that you are going to launch via your service file in order to probe targets;
  • blackbox.yml: configuration file for the Blackbox exporter. This is where you are going to define your modules and probers.

Documentation for the blackbox_exporter executable is available when running the following command

$ cd blackbox_exporter-0.14.0.linux-amd64
$ ./blackbox_exporter -h

blackbox-help

As you can see, the configuration for the Blackbox exporter is pretty straightforward. Those are the flags that we are going to use when defining our systemd service file.

b – Create a service file for the Blackbox exporter

As a meticulous system administrator, you are not going to launch executables from your home directory.

Instead, you are going to define service files and define the start and restart policies for them.

First, make your executables accessible for your user’s local account.

$ sudo mv blackbox_exporter /usr/local/bin

Note: By moving files to the /usr/local/bin path, all users may have access to the blackbox exporter binary. For binaries to be restricted to your own user account, you need to add the path to your own PATH environment variable.

Next, create configuration folders for your blackbox exporter.

$ sudo mkdir -p /etc/blackbox
$ sudo mv blackbox.yml /etc/blackbox

For safety purposes, the Blackbox exporter is going to be run by its own user account (named blackbox here)

As a consequence, we need to create a user account for the Blackbox exporter.

$ sudo useradd -rs /bin/false blackbox

Then, make sure that the blackbox binary can be run by your newly created user.

$ sudo chown blackbox:blackbox /usr/local/bin/blackbox_exporter

Give the correct permissions to your configuration folders recursively.

$ sudo chown -R blackbox:blackbox /etc/blackbox/*

Now that everything is set, it is time for you to create your service file.

To create the Blackbox exporter service, head over to the /lib/systemd/system folder and create a service named blackbox.service

$ cd /lib/systemd/system
$ sudo touch blackbox.service

Edit your service file, and paste the following content into it.

$ sudo nano blackbox.service

[Unit]
Description=Blackbox Exporter Service
Wants=network-online.target
After=network-online.target

[Service]
Type=simple
User=blackbox
Group=blackbox
ExecStart=/usr/local/bin/blackbox_exporter \
  --config.file=/etc/blackbox/blackbox.yml \
  --web.listen-address=":9115"

Restart=always

[Install]
WantedBy=multi-user.target

Note: As you can see, the Blackbox exporter service has no dependencies to other tools of the Prometheus ecosystem or to Prometheus itself.
Save your service file, and make sure that your service is enabled at boot time.

$ sudo systemctl enable blackbox.service
$ sudo systemctl start blackbox.service

For now, the Blackbox exporter is not configured to scrape any targets, but we are going to add a few ones in the next section.

If your service is correctly running, you can check the metrics gathered by issuing a request to the HTTP API.

$ curl http://localhost:9115/metrics

blackbox-metrics

If you navigate to the Blackbox exporter URL with a Web Browser, this is what you should see on your screen.

bb-exporter-web-browser

Now that your Blackbox exporter is gathering metrics, it is time to bind it to Prometheus.

c – Binding the Blackbox exporter with Prometheus

Important Note: In this section, Prometheus is going to scrape the Blackbox Exporter to gather metrics about the exporter itself. To configure Prometheus to scrape HTTP targets, head over to the next sections.

To bind the Blackbox exporter with Prometheus, you need to add it as a scrape target in the Prometheus configuration file.

If you follow the Prometheus setup tutorial, your configuration file is stored at /etc/prometheus/prometheus.yml

Edit this configuration file, and amend the following changes

$ sudo nano /etc/prometheus/prometheus.yml

global:
  scrape_interval:     15s
  evaluation_interval: 15s

scrape_configs:
  - job_name: 'prometheus'
    static_configs:
    - targets: ['localhost:9090', 'localhost:9115']

With Prometheus, you don’t need to restart the systemd service for Prometheus to update.

You can also send a signal to the process for it to restart.

In order to send a SIGHUP signal to your Prometheus process, identify the PID of your Prometheus server.

$ ps aux | grep prometheus
schkn  4431  0.0  0.0  14856  1136 pts/0    S+   09:34   0:00 /bin/prometheus --config.file=...

The PID of my Prometheus process is 4431. Send a SIGHUP signal to this process for the configuration to restart.

$ sudo kill -HUP 4431

Head over to your Prometheus target configuration, and check that you are correctly scrapping your Blackbox exporter.

targets

Great!

Now that the Blackbox exporter is configured with Prometheus, it is time to add our first target.

As a matter of simplicity, we are going to monitor the HTTP endpoint of Prometheus itself with the Blackbox exporter.

Monitoring HTTPS endpoints with the Blackbox Exporter

In our setup, Prometheus is now currently sitting behind a reverse proxy (NGINX) configured with self-signed certificates.

This is the endpoint we are going to monitor with the Blackbox Exporter.

a – Creating a Blackbox module

To monitor Prometheus, we are going to use the HTTP prober.

Head over to your Blackbox configuration file, erase its content and paste the following configuration.

modules:
  http_prometheus:
    prober: http
    timeout: 5s
    http:
      valid_http_versions: ["HTTP/1.1", "HTTP/2"]
      method: GET
      fail_if_ssl: false
      fail_if_not_ssl: true
      tls_config:
        insecure_skip_verify: true
      basic_auth:
        username: "username"
        password: "password"

Here are the details of the parameters we chose.

  • fail_if_not_ssl: As we are actively monitoring an HTTPS endpoint, we need to make sure that we are retrieving the page with SSL encryption. Otherwise, we count it as a failure;
  • insecure_skip_verify: If you followed our previous tutorial, we generated our certificates with self-signed certificates. As a consequence, you are not able to verify it with a certificate authority;
  • basic_auth: The reverse proxy endpoint is configured with a basic username/password authentication. The Blackbox exporter needs to be aware of those to probe the Prometheus server.

Save your file, and check your configuration file with the BlackBox binary itself.

$ blackbox_exporter --config.check

config-file-ok

Great!

Our configuration file seems to be correctly formatted.

Again, there is no need to restart the Blackbox Exporter service. Instead, send a simple SIGHUP signal to the process.

Likewise to the Prometheus process, identify the Blackbox exporter PID.

$ ps aux | grep blackbox
devconnected 574  0.0  0.0  14856  1136 pts/0    S+   09:34   0:00 /usr/local/bin/blackbox_exporter --config.file=...

The PID of my Prometheus process is 574.

Send a SIGHUP signal to this process for the configuration to restart.

$ sudo kill -HUP 574

b – Binding the Blackbox Exporter Module in Prometheus

Now that the module is defined, it is time for Prometheus to start actively using it to monitor our target.

To do so, head over to the Prometheus configuration file, and paste the following changes.

scrape_configs:

...

  - job_name: 'blackbox'
    metrics_path: /probe
    params:
      module: [http_prometheus] 
    static_configs:
      - targets:
        - https://127.0.0.1:1234    # Target to probe with https.
    relabel_configs:
      - source_labels: [__address__]
        target_label: __param_target
      - source_labels: [__param_target]
        target_label: instance
      - target_label: __address__
        replacement: 127.0.0.1:9115  # The blackbox exporter's real hostname:port.

Save your changes, and send a SIGHUP signal to Prometheus for it to restart.

When your server has restarted, head over to https://localhost:1234/config and make sure that your changes were correctly saved.

config-pro

Great!

Prometheus will start scrapping our target now.

To verify it, head over to the /graph endpoint, and issue the following PromQL request.

probe_success{instance="https://127.0.0.1:1234", job="blackbox"}

If your target is up, the probe success should return 1.

probe-success-1

Now that your Blackbox exporter is all set, let’s have a quick Grafana dashboard in order to visualize your results.

Visualizing HTTP metrics on Grafana

a – Installing Grafana on Linux

As always, if you need to install Grafana on your Linux host, make sure to read the dedicated tutorial.

We are not going to create the dashboard by ourselves, instead, we are going to import an existing one that answers our needs.

b – Importing a Grafana dashboard

In order to import a Grafana dashboard, click on the “Plus” icon on the left menu, and click on “Import”.

import-dash 1

On the next window, select the Grafana.com dashboard option, and type the following dashboard ID: 7587.

import-dash-3

From there, Grafana should automatically detect your dashboard.

Select Prometheus as a datasource, and click on “Import“.

b – Importing a Grafana dashboard import-dash-2

That’s it! By clicking on “Import”, your dashboard was automatically created on Grafana.

This is what you should now see on your screen.

final-dash (1)

As you can see, this dashboard focuses on HTTP(s) metrics.

You can have metrics about the up status of your website, the current SSL status as well as the SSL expiry date.

You also have graphs showing the current latencies of your HTTP requests, as well as the average DNS lookup time.

It is noteworthy to say that you can choose the target that you want to monitor by clicking on the “Target” dropdown at the top of the dashboard. In our case, we have only one target, but it can become quite handy when you are monitoring several hosts.

Conclusion

Congratulations, you have successfully installed the Blackbox Exporter with Prometheus. Also, you read how you can install Grafana and import your first dashboard.

This tutorial is only the beginning of your learning path on becoming a monitoring expert.

If you are looking for more resources on monitoring guides, we have a complete section dedicated to it check our entire website for better options in learning various techniques & technologies.

I hope that you learned something new today.

Until then, have fun, as always.

AlertManager and Prometheus Complete Setup on Linux

This tutorial deals with the complete setup of AlertManager and Prometheus on Linux systems.

When we will observe the bad time can’t be defined earlier so that prior safety measures & being alert all the time is more important while working with the modern monitoring solutions in our infrastructure.

Receiving emails if any of our hosts go down is needed or else for an instance, if HTTPS certificates are about to expire then getting a message on our team stack is also necessary.

So, setting up custom alerts is important in your monitoring infrastructure. In this tutorial, we are going to take a special look at the AlertManager with Prometheus. Also, check out this AlertManager and Prometheus Complete Setup on Linux Guide for learning basic fundamentals and the main concept.

Are you Ready?

What is Prometheus?

Prometheus is a monitoring tool created for recording real-time metrics in a time-series database. It is an open-source software project, written in Go. The Prometheus metrics are collected using HTTP pulls, allowing for higher performance and scalability.

Some other Prometheus Tutorials: 

What You Will Learn?

If you read this tutorial until the end, you will learn all the following concepts:

  • How to install Prometheus securely, in HTTPS with authentication.
  • What is the AlertManager and how it binds with Prometheus
  • How to install the AlertManager as a service, using HTTPS.
  • How to configure the AlertManager and create your first rules.

Again, that’s quite a long program, let’s start working.

Installing Prometheus (with SSL and authentication)

The complete Prometheus and Grafana installation and configuration are already covered in one of our previous articles. Check this out for a better understanding of How To Install Prometheus with Docker on Ubuntu 18.04

If you followed carefully this tutorial, you should now have Prometheus configured behind a secure reverse proxy (NGINX in this case).

The authentication is also done on the reverse proxy side.

As a reference, the Prometheus Web UI was accessed using the following URL: https://localhost:1234.

When you are done, you can go to the next section.

What is the AlertManager with Prometheus?

The AlertManager is a tool that will allow you to create custom alerts with Prometheus, and define recipients for them.

a – AlertManager general concepts

The AlertManager is an alerting server that handles alerts provided by a set of clients (a Prometheus server for example) and dispatches them to a group of defined receivers (Slack, email, or Pagerduty for example).

As illustrated, the AlertManager is part of the Prometheus stack, but it is run as a standalone server aside from Prometheus.

By default, Prometheus will take care of sending alerts directly to the AlertManager if it is correctly configured as a Prometheus target.

If you are using clients different from Prometheus itself, the AlertManager exposes a set of REST endpoints that you can use to fire alerts.

The AlertManager API documentation is available here.

a – AlertManager general concepts alert-manager-works

b – What are the AlertManager routes?

The AlertManager works with configuration files defined in YAML format.

At the top of your configuration file, you are going to define routes.

Routes are a set of paths that alerts take in order to determine which action should be associated with the alert. In short, you associate a route with a receiver.

The initial route also called the “root route” is a route that matches every single alert sent to the AlertManager.

A route can have siblings and children that are also routes themselves. This way, routes can be nested any number of times, each level defining a new action (or receiver) for the alert.

Each route defines receivers. Those receivers are the alert recipients: Slack, a mail service, Pagerduty..

As always, a schema is better than words.

b – What are the AlertManager routes New-Wireframe

c – How are the AlertManager routes evaluated?

Now that you have a better idea of what the AlertManager routes are, let’s see how they are evaluated.

On each route, you can define a continuous attribute.

The continue attribute is a value used to define if you want to evaluate route siblings (belonging to the same level) if a route on the same level was already matching.

Note that the continue attribute is not used to determine if you want to go across children routes, but only siblings routes.

The AlertManager will evaluate children’s routes until there are no routes left or no routes for a given level are matching the current alert.

In that case, the AlertManager will take the configuration of the current node evaluated.

c – How are the AlertManager routes evaluated continue-attribute

Now that you have a better understanding of how alerts work on Prometheus, it is time for us to start configuring it on our Linux system.

Installing the AlertManager with Prometheus

First, we are going to download the latest version of the AlertManager and configure it as a server on our instance.

a – Downloading the AlertManager

In order to install the AlertManager, head over to the Prometheus downloads page.

At the top of the page, filter your results by choosing Linux as an operating system.

operating-systems

Scroll a bit, and find the AlertManager section, right below the Prometheus executable.

alert-manager-prometheus

Click on the archive to download it, or run a simple wget command to download the file.

$ wget https://github.com/prometheus/alertmanager/releases/download/v0.18.0/alertmanager-0.18.0.linux-amd64.tar.gz

You should now have the archive on your system.

Extract the files from the archive.

$ tar xvzf alertmanager-0.18.0.linux-amd64.tar.gz

alert-manager-archive

In the folder where you extracted your files, you should find the following entries:

  • amtool: the amtool is an executable that allows you to view or to modify the current state of the AlertManager. In other words, the amtool can silence alerts, expire silences, as well as import silences or query them. It can be seen as a utility to customize the AlertManager without directly modifying the configuration of your current alerts.
  • alertmanager: the executable for the alertmanager. This is the executable that you will run in order to start an AlertManager server on your instance.
  • alertmanager.yml: as its name suggests, this is the configuration file for the AlertManager. This configuration file already defines some example routes, but we will create our own alert file.

If you are interested, here’s the documentation of the amtool.

Now that you have downloaded the AlertManager, let’s see how you can launch it as a service.

b – Starting the AlertManager as a service

In order to start the AlertManager as a service, you are going to move the executables to the /usr/local/bin folder.

$ sudo mv amtool alertmanager /usr/local/bin

For the configuration files, create a new folder in /etc called alertmanager.

$ sudo mkdir -p /etc/alertmanager
$ sudo mv alertmanager.yml /etc/alertmanager

Create a data folder at the root directory, with a Prometheus folder inside.

$ sudo mkdir -p /data/alertmanager

Next, create a user for your upcoming service.

$ sudo useradd -rs /bin/false alertmanager

Give permissions to your newly created user for the AlertManager binaries.

$ sudo chown alertmanager:alertmanager /usr/local/bin/amtool /usr/local/bin/alertmanager

Give the correct permissions to those folders recursively.

$ sudo chown -R alertmanager:alertmanager /data/alertmanager /etc/alertmanager/*
Awesome! Time to create the service.

To create a Linux service (using systemd), head over to the /lib/systemd/system folder and create a service named alertmanager.service

$ cd /lib/systemd/system
$ sudo touch alertmanager.service

Likewise to our Prometheus, let’s first run the alertmanager executable with a “-h” flag to see our options.

$ alertmanager -h

alertmanager-help

In this case, we are interested in a couple of options:

  • config.file: we need to set this variable to the correct configuration file of the “etc/alertmanager” folder.
  • storage.path: again, we defined a custom folder for data which is “/data/alertmanager”
  • web.external-url: if you followed the Prometheus setup entirely, your Prometheus instance is running behind a reverse proxy. In this case, we are going to set the URL for the AlertManager to be externally reachable. Note that this step is optional, but if you plan on reaching the AlertManager from the outside world, there is a chapter dedicated to it.

Edit your service file, and paste the following content inside.

$ sudo nano alertmanager.service

[Unit]
Description=Alert Manager
Wants=network-online.target
After=network-online.target

[Service]
Type=simple
User=alertmanager
Group=alertmanager
ExecStart=/usr/local/bin/alertmanager \
  --config.file=/etc/alertmanager/alertmanager.yml \
  --storage.path=/data/alertmanager

Restart=always

[Install]
WantedBy=multi-user.target

Save your file, enable the service and start it.

$ sudo systemctl enable alertmanager
$ sudo systemctl start alertmanager

alertmanager-service

Now that the AlertManager is running, let’s verify that everything is running properly.

By default, the AlertManager is running on port 9093.

This is the Web UI that you should see on your instance.

alertmanager-web-ui

Not accessible on port 9093? Run a simple ls of command to determine the port on which the AlertManager is currently listening.

Awesome! Our AlertManager is up and running.

Now, it is time to tell Prometheus to bind with the AlertManager.

c – Binding AlertManager with Prometheus

Go back to your Prometheus configuration directory, and edit the following changes.

$ cd /etc/prometheus/prometheus.yml


alerting:
  alertmanagers:
  - static_configs:
    - targets:
      - localhost:9093

Restart Prometheus, and make sure that everything is running smoothly.

$ sudo systemctl restart prometheus

In the next chapter, we are going to configure it to be remotely accessible behind a reverse proxy. The next chapter is optional, so if you want to skip it, you can directly read the section on building our first alert with Slack.

Setting up a reverse proxy for the AlertManager (optional)

The reverse proxy setup with NGINX was already covered in our previous tutorial. (see Prometheus & Grafana setup)

Make sure to read this part and come back to this tutorial once you have everything ready.

a – Creating a proxy configuration file

Similar to our Prometheus proxy configuration file, we are going to create one for the AlertManager.

The conf.d directory is where we are going to create our reverse proxy configuration file for the AlertManager.

Create a new file in this directory called alertmanager.conf.

$ cd /etc/nginx/conf.d
$ sudo touch alertmanager.conf

Paste the following content in your file.

server {
    listen 3456;

    location / {
      proxy_pass           http://localhost:9093/;
    }
}

I choose port 3456 for my AlertManager but feel free to choose a port that fits your infrastructure.

Save your configuration, and restart your NGINX server for the modifications to be applied.

$ sudo systemctl restart nginx

-- Any errors? Inspect your journal
$ sudo journalctl -f -u nginx.service

This is what you should now see (when browsing

behind-proxy

Awesome, let’s have some reverse proxy authentication for the AlertManager now.

b – Setting up the reverse proxy authentication

If you want to use the Prometheus credentials file described in the previous tutorial, you can.

In this case, I am going to create a brand new authentication file dedicated to the AlertManager.

First, you are going to need the htpasswd utility in order to create the authentication file.

This utility comes with the apache2-utils package, so make sure to install it first.

$ sudo apt-get install apache2-utils
$ cd /etc/alertmanager
$ sudo htpasswd -c .credentials admin 

Again, choose a strong password as this endpoint is supposed to be accessible online.

credentials

Back to your NGINX configuration file (located at /etc/nginx/conf.d), change your server configuration to take into account the new credentials.

$ cd /etc/nginx/conf.d

server {
    listen 3456;

    location / {
      auth_basic           "AlertManager";
      auth_basic_user_file /etc/alertmanager/.credentials;
      proxy_pass           http://localhost:9093/;
    }
}

Great! You should now be asked for credentials when trying to reach http://localhost:3456.

c – Securing the AlertManager with TLS/SSL

We have already covered those steps in our Prometheus & Grafana guide, but in a similar way, we are going to create self-signed certificates and import them into NGINX.

Create Keys for the AlertManager

First, make sure that you have the gnutls packages available on your distribution.

As a reminder, here’s how to install them.

(Ubuntu)
$ sudo apt-get install gnutls-utils

(Debian)
$ sudo apt-get install gnutls-bin

Go to your /etc/ssl directory, and create a new folder for the AlertManager.

$ cd /etc/ssl
$ sudo mkdir alertmanager

Go to your new folder, and create a private key for the AlertManager.

$ sudo certtool --generate-privkey --outfile alertmanager-private-key.pem

When you are done, create a new certificate (also called the public key).

$ sudo certtool --generate-self-signed --load-privkey alertmanager-private-key.pem --outfile alertmanager-cert.pem
  # The certificate will expire in (days): 3650
  # Does the certificate belong to an authority? (Y/N): y
  # Will the certificate be used to sign other certificates? (Y/N): y
  # Will the certificate be used to sign CRLs? (y/N): y

Choose a validity that works for you, in this case, I chose 10 years.

Now that your keys are created, let’s add them to our NGINX configuration.

Reconfiguring NGINX for HTTPS

Find your configuration in the /etc/nginx/conf.d directory, and paste the following changes.

$ cd /etc/nginx/conf.d
$ sudo nano alertmanager.conf

server {
    listen 3456 ssl;
    ssl_certificate /etc/ssl/alertmanager/alertmanager-cert.pem;
    ssl_certificate_key /etc/ssl/alertmanager/alertmanager-private-key.pem;

    location / {
      auth_basic           "AlertManager";
      auth_basic_user_file /etc/alertmanager/.credentials;
      proxy_pass           http://localhost:9093/;
    }
}

When you are done, restart your NGINX server, and verify that the changes were applied.

$ sudo systemctl restart nginx

If you have any trouble launching NGINX, make sure to run the following command.

$ sudo journalctl -f -u nginx.service

Modifying the AlertManager service

Now that NGINX is configured to deliver content via HTTPS, let’s modify the service to take into account the external URL parameter.

Back to the /lib/systemd/system folder, modify the service accordingly.

$ cd /lib/systemd/system
$ sudo nano alertmanager.service

[Service]
Type=simple
User=alertmanager
Group=alertmanager
ExecStart=/usr/local/bin/alertmanager \
  --config.file=/etc/alertmanager/alertmanager.yml \
  --storage.path=/data/alertmanager \
  --web.external-url=https://localhost:3456

Save your file and restart your service.

$ sudo systemctl daemon-reload
$ sudo systemctl restart alertmanager

Make sure that your AlertManager is still accessible via the proxy.

Modifying the AlertManager service

Conclusion

In this tutorial, you had a complete overview of how to setup the AlertManager with Prometheus on Linux.

You have successfully setup an AlertManager instance running behind a reverse proxy, with authentication and encryption.

As I write more articles using the AlertManager rules and alerts, those articles will probably be linked here.

I hope that you learned something new today. Until then, have fun, as always.

How To Add A User to Sudoers On CentOS 8

How To Add A User to Sudoers On CentOS 8 | Centos 8 Add User to Group

Are you in a confused state to work with Add User to Sudoers CentOS? Then this tutorial on How To Add A User to Sudoers On CentOS 8 will definitely assist you through the process and clarifies all your queries regarding the concept.

Learning each and every concept right from the basis is very important and helpful. So let’s start with the definitions and their uses.

CentOS is a free and open-source Enterprise Linux distro obtained from an upstream distro known as Red Hat Enterprise Linux (RHEL). CentOS is mostly used on servers and clusters.

The sudocommand is the famous command available on Linux and it permits users to execute commands with the security privileges of another user, by default the root user. The /etc/sudoers file contains a security policy for system users and groups that is used by the sudo command.

Today’s tutorial focuses on all the information about adding a user to sudoers on CentOS 8 (the most recent CentOS distribution) and also details regarding two ways of adding a user to sudoers: add it to the wheel group (similar to the sudo group on Debian-based distributions) or add the user to the sudoers file.

Prerequisites

In order to grant the sudo rights to an existing user, you are going to need the sudo command on your CentOS 8 host.

First, make sure that your packages are up to date on your host and install the sudo command.

$ su -
$ yum update
$ yum install sudo

To verify that the sudo command is correctly installed, you can run the following command

$ sudo -l

Prerequisites

Do Check Other Linux Tutorials: 

Procedure to add or create a sudo user on CentOS 8

  • Open the terminal application
  • For remote CentOS Server, use the ssh command and log in as the root user using either su or sudo.
  • Create a new CentOS user named tom, run: useradd tom
  • Set the password, execute: passwd tom
  • Make tom user sudo user on CentOS Linux 8, run: usermod -aG wheel tom
  • Verify it by running the id tom command

Adding an existing user to the wheel group

The first way to add a user to sudoers is to add it to the wheel group.

In order to add your user to the group, you can either use the usermod or the gpasswd command.

$ sudo usermod -aG wheel <user>

Alternatively, here is the syntax using the gpasswd command.

$ sudo gpasswd -a <user> wheel
Adding user to the group wheel

Adding an existing user to the wheel group wheel-1

Make sure that the user belongs to the wheel group with the groups command.

$ su - <user>
(enter the password for user)

$ groups
user wheel

wheel-2

Alternatively, you can run the sudo command on the user you granted administrative rights.

$ sudo -l

Congratulations!

You have added a user to sudoers on CentOS 8.

During your CentOS 8 installation process, if you chose not to set a root password, your root account may be locked by default. As a consequence, you will need to set a password to the root user account if you need to unlock it.

Adding an existing user to the sudoers file

The other method to grant administrative rights is to add the user to the sudoers file.

By default, the sudoers file is located at /etc/sudoers by default.

This file contains a set of rules that are applied to determine who has administrative rights on a system, which commands they can execute with sudo privileges, and if they should be prompted a password or not.

However, you should not modify the sudoers file by yourself because if you make any mistakes during the process, you might be locked out of your host forever.

Instead of modifying the sudoers file by yourself, you are going to use visudo.

Visudo is a tool that checks the integrity and the correctness of the commands typed before saving the sudoers file.

To execute visudo, type the following command

$ sudo visudo

You should now see the following screen
Adding an existing user to the sudoers file visudo

At the end of the file, add the following line.

$ <user>       ALL=(ALL:ALL) ALL

Here are some details about the syntax of the sudoers file.

sudoers-syntax

By default, the account password will be asked every five minutes to perform sudo operations.

However, if you want to remove this password verification, you can set theNOPASSWDoption.

$ <user>       ALL=(ALL:ALL) NOPASSWD:ALL

If you want to increase the password verification time, you can modify the timestamp_timeout (expressed in minutes).

In the example shown below, you will be asked to provide your user password every thirty minutes.

# /etc/sudoers
#
# This file MUST be edited with the 'visudo' command as root.
#
# See the man page for details on how to write a sudoers file.
#

Defaults        env_reset
Defaults        mail_badpass
Defaults        secure_path = /sbin:/bin:/usr/sbin:/usr/bin
Defaults        timestamp_timeout=30

Adding a group to the sudoers file

In the sudoers file, you can add a user but you can also add an entire group which can be quite handy if you want to have specific rules for different groups.

To add a group to the sudoers file, simply add a percent symbol at the beginning of the line.

$ %sysadmins       ALL=(ALL:ALL) NOPASSWD:ALL

Make sure that your user is part of the designed group with the groups command.

$ su - user
$ groups
user sysadmins

Again, you can test that your changes were applied by changing your password for example

$ sudo passwd

Quick Steps To Create a New Sudo-enabled User on CentOS 8

The steps that should follow for performing how to create a new user with sudo access on CentOS 8 are given here:

  1. Logging Into Your Server
  2. Adding a New User to the System
  3. Adding the User to the wheel Group
  4. Testing sudo Access

Conclusion

In this tutorial, you learned how you can add a user to sudoers on CentOS 8, by using the usermod command or by changing the sudoers file.

If you are interested in Linux System Administration, we have dedicated a section for it on our website, kindly check it out for more information.

How To Setup Telegraf InfluxDB and Grafana on Linux

How To Setup Telegraf InfluxDB and Grafana on Linux | TIG Stack Setup on Linux

The TIG (Telegraf, InfluxDB, and Grafana) stack is apparently the most famous among all existing modern monitoring tools. Also, this stack is very helpful in monitoring a board panel of various datasources like from Operating systems to databases. There are unlimited possibilities and the origin of the TLG stack is very easy to follow.

Today’s tutorial is mainly on How To Setup Telegraf InfluxDB and Grafana on Linux along with that you can also gain proper knowledge about InfluxDB, Telegraf, and Grafana.

As you can know, Telegraf is a tool that takes responsibility for gathering and aggregating data, like the current CPU usage for instance. InfluxDB will store data, and expose it to Grafana, which is a modern dashboarding solution.

Moreover, we are securing our instances with HTTPS via secure certificates.

modern-monitoring-architecture

Also, it comprises steps for Influx 1.7.x, but I will link to the InfluxDB 2.x setup once it is written.

Prerequisites

If you are following our tutorial to install all these monitoring tools then ensure that you have sudo privileges on the system, otherwise, you won’t be able to install any packages further.

Installing InfluxDB

The complete Installation of InfluxDB can be acquired from this active link. So, make use of it properly and finish your InfluxDB installation.

If you guys looking for the complete guide on How to Install InfluxDB on Windows, then go for it using the available link & start gaining the knowledge.

Later, we are going to learn how to install Telegraf from the below modules:

Installing Telegraf

Telegraf is an agent that collects metrics related to a wide panel of different targets. It can also be used as a tool to processaggregatesplit, or group data.

The whole list of available targets (also called inputs) is available here. In our case, we are going to use InfluxDB as an output.

a – Getting packages on Ubuntu distributions

To download packages on Ubuntu 18.04+, run the following commands:

$ wget -qO- https://repos.influxdata.com/influxdb.key | sudo apt-key add -
$ source /etc/lsb-release
$ echo "deb https://repos.influxdata.com/${DISTRIB_ID,,} ${DISTRIB_CODENAME} stable" | sudo tee /etc/apt/sources.list.d/influxdb.list

This is the output that you should see.
install-telegraf-ubuntu

b – Getting packages on Debian distributions.

To install Telegraf on Debian 10+ distributions, run the following commands:

First, update your apt packages and install the apt-transport-https package.

$ sudo apt-get update
$ sudo apt-get install apt-transport-https<

Finally, add the InfluxData keys to your instance.

Given your Debian version, you have to choose the corresponding packages.

$ cat /etc/debian_version
10.0

get-debian-version

$ wget -qO- https://repos.influxdata.com/influxdb.key | sudo apt-key add -
$ source /etc/os-release


# Debian 7 Wheezy
$ test $VERSION_ID = "7" && echo "deb https://repos.influxdata.com/debian wheezy stable" | sudo tee /etc/apt/sources.list.d/influxdb.list

# Debian 8 Jessie
$ test $VERSION_ID = "8" && echo "deb https://repos.influxdata.com/debian jessie stable" | sudo tee /etc/apt/sources.list.d/influxdb.list

# Debian 9 Stretch
$ test $VERSION_ID = "9" && echo "deb https://repos.influxdata.com/debian stretch stable" | sudo tee /etc/apt/sources.list.d/influxdb.list

# Debian 10 Buster
$ test $VERSION_ID = "10" && echo "deb https://repos.influxdata.com/debian buster stable" | sudo tee /etc/apt/sources.list.d/influxdb.list

debian-10-install

c – Install Telegraf as a service

Now that all the packages are available, it is time for you to install them.

Update your package list and install Telegraf as a service.

$ sudo apt-get update
$ sudo apt-get install telegraf

d – Verify your Telegraf installation

Right now, Telegraf should run as a service on your server.

To verify it, run the following command:

$ sudo systemctl status telegraf

Telegraf should run automatically, but if this is not the case, make sure to start it.

$ sudo systemctl start telegraf

telegraf-running

However, even if your service is running, it does not guarantee that it is correctly sending data to InfluxDB.

To verify it, check your journal logs.

$ sudo journalctl -f -u telegraf.service

telegraf-running-correctly

If you are having error messages in this section, please refer to the troubleshooting section at the end.

Configure InfluxDB Authentication

In order to have a correct TIG stack setup, we are going to setup InfluxDB authentication for users to be logged in when accessing the InfluxDB server.

a – Create an admin account on your InfluxDB server

Before enabled HTTP authentication, you are going to need an admin account.

To do so, head over to the InfluxDB CLI.

$ influx
Connected to http://localhost:8086 version 1.7.7
InfluxDB shell version: 1.7.7

> CREATE USER admin WITH PASSWORD 'password' WITH ALL PRIVILEGES
> SHOW USERS

user   admin
----   -----
admin  true

b – Create a user account for Telegraf

Now that you have an admin account, create an account for Telegraf

> CREATE USER telegraf WITH PASSWORD 'password' WITH ALL PRIVILEGES
> SHOW USERS

user      admin
----      -----
admin     true
telegraf  true

c – Enable HTTP authentication on your InfluxDB server

HTTP authentication needs to be enabled in the InfluxDB configuration file.

Head over to /etc/influxdb/influxdb.conf and edit the following lines.

[http]
  # Determines whether HTTP endpoint is enabled.
  enabled = true
  
  # The bind address used by the HTTP service.
  bind-address = ":8086"

  # Determines whether user authentication is enabled over HTTP/HTTPS.
  auth-enabled = true

d – Configure HTTP authentication on Telegraf

Now that a user account is created for Telegraf, we are going to make sure that it uses it to write data.

Head over to the configuration file of Telegraf, located at /etc/telegraf/telegraf.conf.

Modify the following lines :

## HTTP Basic Auth
  username = "telegraf"
  password = "password"

Restart the Telegraf service, as well as the InfluxDB service.

$ sudo systemctl restart influxdb
$ sudo systemctl restart telegraf

Again, check that you are not getting any errors when restarting the service.

$ sudo journalctl -f -u telegraf.service

Awesome, our requests are now authenticated.

Time to encrypt them.

Configure HTTPS on InfluxDB

Configuring secure protocols between Telegraf and InfluxDB is a very important step.

You would not want anyone to be able to sniff data you are sending to your InfluxDB server.

If your Telegraf instances are running remotely (on a Raspberry Pi for example), securing data transfer is a mandatory step as there is a very high chance that somebody will be able to read the data you are sending.

a – Create a private key for your InfluxDB server

First, install the gnutls-utils package that might come as gnutls-bin on Debian distributions for example.

$ sudo apt-get install gnutls-utils
(or)
$ sudo apt-get install gnutls-bin

Now that you have the certtool installed, generate a private key for your InfluxDB server.

Head over to the /etc/ssl folder of your Linux distribution and create a new folder for InfluxDB.

$ sudo mkdir influxdb && cd influxdb
$ sudo certtool --generate-privkey --outfile server-key.pem --bits 2048

b – Create a public key for your InfluxDB server

$ sudo certtool --generate-self-signed --load-privkey server-key.prm --outfile server-cert.pem

Great! You now have a key pair for your InfluxDB server.

Do not forget to set permissions for the InfluxDB user and group.

$ sudo chown influxdb:influxdb server-key.pem server-cert.pem

c – Enable HTTPS on your InfluxDB server

Now that your certificates are created, it is time to tweak our InfluxDB configuration file to enable HTTPS.

Head over to /etc/influxdb/influxdb.conf and modify the following lines.

# Determines whether HTTPS is enabled.
  https-enabled = true

# The SSL certificate to use when HTTPS is enabled.
https-certificate = "/etc/ssl/influxdb/server-cert.pem"

# Use a separate private key location.
https-private-key = "/etc/ssl/influxdb/server-key.pem"

Restart the InfluxDB service and make sure that you are not getting any errors.

$ sudo systemctl restart influxdb
$ sudo journalctl -f -u influxdb.service

d – Configure Telegraf for HTTPS

Now that HTTPS is available on the InfluxDB server, it is time for Telegraf to reach InfluxDB via HTTPS.

Head over to /etc/telegraf/telegraf.conf and modify the following lines.

# Configuration for sending metrics to InfluxDB
[[outputs.influxdb]]

# https, not http!
urls = ["https://127.0.0.1:8086"]

## Use TLS but skip chain & host verification
insecure_skip_verify = true
Why are we enabling the insecure_skip_verify parameter?

Because we are using a self-signed certificate.

As a result, the InfluxDB server identity is not certified by a certificate authority. If you want an example of what a full-TLS authentication looks like, make sure to read the guide to centralized logging on Linux.

Restart Telegraf, and again make sure that you are not getting any errors.

$ sudo systemctl restart telegraf
$ sudo journalctl -f -u telegraf.service

Exploring your metrics on InfluxDB

Before installing Grafana and creating our first Telegraf dashboard, let’s have a quick look at how Telegraf aggregates our metrics.

By default, for Linux systems, Telegraf will start gathering related to the performance of your system via plugins named cpu, disk, diskio, kernel, mem, processes, swap, and system.

Names are pretty self-explanatory, those plugins gather some metrics on the CPU usagethe memory usage as well as the current disk read and write IO operations.

Looking for a tutorial dedicated to Disk I/O? Here’s how to setup Grafana and Prometheus to monitor Disk I/O in real-time.

Let’s have a quick look at one of the measurements.

To do this, use the InfluxDB CLI with the following parameters.

Data is stored in the “telegraf” database, each measurement being named as the name of the input plugin.

$ influx -ssl -unsafeSsl -username 'admin' -password 'password'
Connected to http://localhost:8086 version 1.7.7
InfluxDB shell version: 1.7.7

> USE telegraf
> SELECT * FROM cpu WHERE time > now() - 30s

influxdb-query

Great!

Data is correctly being aggregated on the InfluxDB server.

It is time to setup Grafana and builds our first system dashboard.

Installing Grafana

The installation of Grafana has already been covered extensively in our previous tutorials.

You can follow the instructions detailed here in order to install it.

a – Add InfluxDB as a datasource on Grafana

In the left menu, click on the Configuration > Data sources section.

config-datasource

In the next window, click on “Add datasource“.

add-data-source

In the datasource selection panel, choose InfluxDB as a datasource.

influxdb-option

Here is the configuration you have to match to configure InfluxDB on Grafana.

influxdb-config

Click on “Save and Test”, and make sure that you are not getting any errors.

data-source-is-working

Getting a 502 Bad Gateway error? Make sure that your URL field is set to HTTPS and not HTTP.

If everything is okay, it is time to create our Telegraf dashboard.

b – Importing a Grafana dashboard

We are not going to create a Grafana dashboard for Telegraf, we are going to use a pre-existing one already developed by the community.

If in the future you want to develop your own dashboard, feel free to do it.

To import a Grafana dashboard, select the Import option in the left menu, under the Plus icon.

import-dashboard (1)

On the next screen, import the dashboard with the 8451 ID.

This is a dashboard created by Gabriel Sagnard that displays system metrics collected by Telegraf.

import-dashboard-23

From there, Grafana should automatically try to import this dashboard.

Add the previously configured InfluxDB as the dashboard datasource and click on “Import“.

import-dashboard-3

Great!

We now have our first Grafana dashboard displaying Telegraf metrics.

This is what you should now see on your screen.

b – Importing a Grafana dashboard final-dashboard

c – Modifying InfluxQL queries in Grafana query explorer

When designing this dashboard, the creator specified the hostname as “Nagisa”, which is obviously different from one host to another (mine is for example named “Debian-10”)

To modify it, head over to the query explorer by hovering the panel title, and clicking on “Edit”.

edit-dashboard

In the “queries” panel, change the host, and the panel should starting displaying data.

changing-host

Go back to the dashboard, and this is what you should see.

cpu-dashboard

Conclusion

In this tutorial, you learned how to setup a complete Telegraf, InfluxDB, and Grafana stack on your server.

So where should you go from there?

The first thing would be to connect Telegraf to different inputs, look for existing dashboards in Grafana or design your own ones.

Also, we already made a lot of examples using Grafana and InfluxDB, you could maybe find some inspiration reading those tutorials.

Troubleshooting

  • Error writing to output [influxdb]: could not write any address

error-output-telegraf

Possible solution: make sure that InfluxDB is correctly running on the port 8086.

$ sudo lsof -i -P -n | grep influxdb
influxd   17737        influxdb  128u  IPv6 1177009213      0t0  TCP *:8086 (LISTEN)

If you are having a different port, change your Telegraf configuration to forward metrics to the custom port that your InfluxDB server was assigned.

    • [outputs.influxdb] when writing to [http://localhost:8086] : 401 Unauthorized: authorization failed

Possible solution: make sure that the credentials are correctly set in your Telegraf configuration. Make sure also that you created an account for Telegraf on your InfluxDB server.

    • http: server gave HTTP response to HTTPS client

Possible solution: make sure that you enabled the https-authentication parameter in the InfluxDB configuration file. It is set by default to false.

  • x509: cannot validate certificate for 127.0.0.1 because it does not contain any IP SANs

Possible solution: your TLS verification is set, you need to enable the insecure_skip_verify parameter as the server identity cannot be verified for self-signed certificates.

Windows Server Monitoring using Prometheus and WMI Exporter

Windows Server Monitoring using Prometheus and WMI Exporter | How to Install WMI Exporter in Windows?

Guys who are working as a DevOps engineer or a Site Reliability Engineer should aware of various techniques to monitor their Windows servers. If you are familiar with such tasks then you can easily solve your windows server down issues.

You may get some random doubts whenever your serves go down like Is it due to the high CPU usage on one of the processes? Is the RAM used too much on my Windows server? or Is the server having some memory issues?

To clarify all these queries today we have come up with a new interesting tutorial ie., Windows Server Monitoring using Prometheus and WMI Exporter.

If you are not having an overview of Prometheus Monitoring, check out this Definitive Guide by clicking on the link and start learning about the monitoring of windows servers with Prometheus and WMI Exporter.

Are you ready to monitor your Windows Servers? If yes, then go through these direct links for quick access to the main concept of this tutorial.

What is WMI Exporter?

WMI Exporter is an exporter utilized for windows servers to collects metrics like CPU usage, memory, and Disk usage.

It is open-source which can be installed on Windows servers using the .msi installer

Prerequisites

If you want to follow this tutorial, then you require the following stuff:

  • One Linux server set up
  • Prometheus 2.x installed on your server, including the Prometheus Web UI.
  • Check out your Prometheus version by running the Prometheus -version command. The output comprises your Prometheus version as well as build information.

Windows Server Monitoring Architecture

Before installing the WMI exporter, let’s have a quick look at what our final architecture looks like.

As a reminder, Prometheus is constantly scraping targets.

Targets are nodes that are exposing metrics on a given URL, accessible by Prometheus.

Such targets are equipped with “exporters”: exporters are binaries running on a target and responsible for getting and aggregating metrics about the host itself.

If you were to monitor a Linux system, you would run a “Node Exporter“, which would be responsible for gathering metrics about the CPU usage or the disk I/O currently in use.

For Windows hosts, you are going to use the WMI exporter.

The WMI exporter will run as a Windows service and it will be responsible for gathering metrics about your system.

In short, here is the final architecture that you are going to build.

windows-arch

Installing Prometheus

The complete Prometheus installation for Linux was already covered in one of our previous articles. Check out our Prometheus tutorials main page or else click on this direct link How To Install Prometheus with Docker on Ubuntu 18.04

Ensure to read it extensively to have your Prometheus instance up and running.

To verify it, head over to http://localhost:9090 (9090 being the default Prometheus port).

You should see a Web Interface similar to this one.

If this is the case, it means that your Prometheus installation was successful.

prometheus-homepage

Great!

Now that your Prometheus is running, let’s install the WMI exporter on your Windows Server.

Installing the WMI Exporter

The WMI exporter is an awesome exporter for Windows Servers.

It will export metrics such as CPU usage, memory, and disk I/O usage.

The WMI exporter can also be used to monitor IIS sites and applications, the network interfaces, the services, and even the local temperature!

If you want a complete look at everything that the WMI exporter offers, have a look at all the collectors available.

In order to install the WMI exporter, head over to the WMI releases page on GitHub.

a – Downloading the WMI Exporter MSI

As of August 2019, the latest version of the WMI exporter is 0.8.1.

wmi-exporter-v0.8.1

On the releases page, download the MSI file corresponding to your CPU architecture.

In my case, I am going to download the wmi_exporter-0.8.1-amd64.msi file.

b – Running the WMI installer

When the download is done, simply click on the MSI file and start running the installer.

This is what you should see on your screen.

wmi-exporter-msi

Windows should now start configuring your WMI exporter.
configuring-the-wmi-exporter

You should be prompted with a firewall exception. Make sure to accept it for the WMI exporter to run properly.

The MSI installation should exit without any confirmation box. However, the WMI exporter should now run as a Windows service on your host.

To verify it, head over to the Services panel of Windows (by typing Services in the Windows search menu).

In the Services panel, search for the “WMI exporter” entry in the list. Make sure that your service is running properly.

wmi-exporter-service

c – Observing Windows Server metrics

Now that your exporter is running, it should start exposing metrics on

Open your web browser and navigate to the WMI exporter URL. This is what you should see in your web browser.

Some metrics are very general and exported by all the exporters, but some of the metrics are very specific to your Windows host (like the wmi_cpu_core_frequency_mhz metric for example)

prom-metrics

Great!

Now, Windows Server monitoring is active using the WMI exporter.

If you remember correctly, Prometheus scrapes targets.

As a consequence, we have to configure our Windows Server as a Prometheus target.

This is done in the Prometheus configuration file.

d – Binding Prometheus to the WMI exporter

As you probably saw from your web browser request, the WMI exporter exports a lot of metrics.

As a consequence, there is a chance that the scrape request times out when trying to get the metrics.

This is why we are going to set a high scrape timeout in our configuration file.

If you want to keep a low scrape timeout, make sure to configure the WMI exporter to export fewer metrics (by specifying just a few collectors for example).

Head over to your configuration file (mine is located at /etc/prometheus/prometheus.yml) and edit the following changes to your file.

scrape_configs:
# The job name is added as a label `job=<job_name>` to any timeseries scraped from this config.
  - job_name: 'prometheus'

    # Careful, the scrape timeout has to be lower than the scrape interval.
    scrape_interval: 6s
    scrape_timeout: 5s
    static_configs:
            - targets: ['localhost:9090', 'localhost:9216']

Save your file, and restart your Prometheus service.

$ sudo systemctl restart prometheus
$ sudo systemctl status prometheus

Head back to the Prometheus UI, and select the “Targets” tab to make sure that Prometheus is correctly connected to the WMI exporter.

wmi-target

If you are getting the following error, “context deadline exceeded”, make sure that the scrape timeout is set in your configuration file.

Great! Our Windows Server monitoring is almost ready.

Now it is time for us to start building an awesome Grafana dashboard to monitor our Windows Server.

Building an Awesome Grafana Dashboard

Complete MySQL dashboard with Grafana & Prometheus and MongoDB Monitoring with Grafana & Prometheus are some of our previous guides on Prometheus & Grafana installation. Make sure to configure your Grafana properly before moving to the next section.

If you are looking to install Grafana on Windows, here is another guide for it.

Prometheus should be configured as a Grafana target and accessible through your reverse proxy.

a – Importing a Grafana dashboard

In Grafana, you can either create your own dashboards or you can use pre-existing ones that contributors already crafted for you.

In our case, we are going to use the Windows Node dashboard, accessible via the 2129 ID.

Head over to the main page of Grafana (located at http://localhost:3000 by default), and click on the Import option in the left menu.

import-grafana
In the next window, simply insert the dashboard ID in the corresponding text field.
import-dash-1
From there, Grafana should automatically detect your dashboard as the Windows Node dashboard. This is what you should see.
windows-node-dashboard
Select your Prometheus datasource in the “Prometheus” dropdown, and click on “Import” for the dashboard to be imported.
final-dashboard-2-1

Awesome!

An entire dashboard displaying Windows metrics was created for us in just one click.

As you can see, the dashboard is pretty exhaustive.

You can monitor the current CPU load, but also the number of threads created by the system, and even the number of system exceptions dispatched.

cpu-load

On the second line, you have access to metrics related to network monitoring. You can for example have a look at the number of packets sent versus the number of packets received by your network card.

It can be useful to track anomalies on your network, in case of TCP flood attacks on your servers for example.

network-1

On the third line, you have metrics related to the disk I/O usage on your computer.

Those metrics can be very useful when you are trying to debug applications (for example ASP.NET applications). Using those metrics, you can see if your application consumes too much memory or too much disk.

disk-io-1

Finally, one of the greatest panels has to be memory monitoring. RAM has a very big influence on the overall system performance.

Consequently, it has to be monitored properly, and this is exactly what the fourth line of the dashboard does.

memory-1

That’s an awesome dashboard, but what if we want to be alerted whenever the CPU usage is too high for example?

Wouldn’t it be useful for our DevOps teams to know about it in order to see what’s causing the outage on the machine?

This is what we are going to do in the next section.

Raising alerts in Grafana on high CPU usage

As discussed in the previous section, you want alerts to be raised when the CPU usage is too high.

Grafana is equipped with an alerting system, meaning that whenever a panel raises an alert it will propagate the alert to “notification channels“.

Notification channels are Slack, your internal mailing system of PagerDuty for example.

In this case, we are going to use Slack as it is a pretty common team productivity tool used in companies.

a – Creating a Slack webhook

For those who are not familiar with Slack, you can create webhooks that essentially address for external sources to reach Slack.

As a consequence, Grafana will post the alert to the Webhook address, and it will be displayed in your Slack channel.

To create a Slack webhook, head over to your Slack apps page.

slack-apps-1

Click on the name of your app (“devconnected” here). On the left menu, click on “Incoming Webhooks”.

slack-apps-2

On the next page, simply click on “Add New Webhook to Workspace“.

slack-apps-3

On the next screen, choose where you want your alert messages to be sent. In this case, I will choose the main channel of my Slack account.
slack-apps-4

Click on “Allow”. From there, your Slack Webhook URL should be created.

webhook-URL

b – Set Slack as a Grafana notification channel

Copy the Webhook URL and head over to the Notifications Channels window of Grafana. This option is located in the left menu.

notif-channel

Click on the option, and you should be redirected to the following window.

add-channel

Click on “Add channel”. You should be redirected to the notification channel configuration page.

Copy the following configuration, and change the webhook URL with the one you were provided with in the last step.

slack-config

When your configuration is done, simply click on “Send Test” to send a test notification to your Slack channel.

test-notif

Great! Your notification channel is working properly.

Let’s create a PromQL query to monitor our CPU usage.

c – Building a PromQL query

If you are not familiar with PromQL, there is a section dedicated to this language in my Prometheus monitoring tutorial.

When taking a look at our CPU usage panel, this is the PromQL query used to display the CPU graph.

promQL-1

First, the query splits the results by the mode (idle, user, interrupt, DPC, privileged). Then, the query computes the average CPU usage for a five minutes period, for every single mode.

In the end, the modes are displayed with aggregated sums.

In my case, my CPU has 8 cores, so the overall usage sums up to 8 in the graph.

8-cpus

If I want to be notified when my CPU usage peaks at 50%, you essentially want to trigger an alert when the idle state goes below 4 (as 4 cores are going to be fully used).

To monitor our CPU usage, we are going to use this query

sum by (mode) (rate(wmi_cpu_time_total{instance=~"localhost:9182", mode="idle"}[5m]))

I am not using a template variable here for the instance as they are not supported by Grafana for the moment.

This query is very similar to the one already implemented in the panel, but it specifies that we specifically want to target the “idle” mode of our CPU.

Replace the existing query with the query we just wrote.

This is what you should now have in your dashboard.

cpu-usage-2

Now that your query is all set, let’s build an alert for it.

d – Creating a Grafana alert

In order to create a Grafana alert, click on the bell icon located right under the query panel.

d – Creating a Grafana alert

In the rule panel, you are going to configure the following alert.

Every 10 seconds, Grafana will check if the average CPU usage for the last 10 seconds was below 4 (i.e using more than 50% of our CPU).

If it is the case, an alert will be sent to Slack, otherwise, nothing happens.

rule-1

Finally, right below this rule panel, you are going to configure the Slack notification channel.

notifications-rule

Now let’s try to bump the CPU usage on our instance.

alertalert

As the CPU usage goes below the 4 thresholds, it should set the panel state to “Alerting” (or “Pending” if you specified a “For” option that is too long).

From there, you should receive an alert in Slack.

slack-alert

As you can see, there is even an indication of the CPU usage (73% in this case).

Great! Now our DevOps is aware that there is an issue on this server and they can investigate what’s happening exactly.

Conclusion

As you can see, monitoring Windows servers can easily be done using Prometheus and Grafana.

With this tutorial, you had a quick overview of what’s possible with the WMI exporter. So what’s next?

From there, you can create your own visualizations, your own dashboards, and your own alerts.

Our monitoring section contains a lot of examples of what’s possible and you can definitely take some inspiration from some of the dashboards.

Until then, have fun, as always.

How To Change Root Password on Debian 10

On Linux, the root account is a special user account on Linux that has access to all files, all commands and that can pretty much do anything on a Linux server.

Most of the time, the root account is disabled, meaning that you cannot access it.

For example, if you did not specify any password for root during the installation process, it might be locked by default.

However, you may want to access the root account sometimes to perform specific tasks.

In this tutorial, you are going to learn how you can change the root password on Debian 10 easily.

Prerequisites

To change the root password on Debian 10, you need to have sudo privileges or to have the actual password of the root account.

$ sudo -l

User <user> may run the following commands on host-debian:
    (ALL : ALL) ALL

If this is the case, you should be able to change the root password.

Be careful : changing the root password on Debian 10 will unlock the root account.

Change root password on Debian using passwd

The easiest way to change the root password on Debian 10 is to run the passwd command with no arguments.

$ sudo passwd

Changing password for user root.
New password:
Retype new password:
passwd: all authentication tokens updated successfully.

Alternatively, you can specify the root user account with the passwd command.

$ sudo passwd root
Recommendation : the root account needs a strong password. It should be at least 10 characters, with special characters, uppercase and lowercase letters.

Also, it should not contain any words that are easily found in a dictionary.

In order to connect as root on Debian 10, use the “su” command without any arguments.

$ su -
Password:
[root@localhost ~]#

Change root password on Debian using passwd su

Change root password on Debian using su

Alternatively, if you are not sudo you can still change the root password if you have the actual root password.

First, make sure to switch user to root by running the “su” command without any arguments.

$ su -
Password:
root@host-debian:~#

Now that you are connected as root, simply run the “passwd” command without any arguments.

$ passwd

Changing password for user root.
New password:
Retype new password:
passwd: all authentication tokens updated successfully.

You can now leave the root account by pressing “Ctrl +D”, you will be redirected your main user account.

Change root password on Debian using su-root

Change root password using single user mode

Another way of changing the root password on Debian 10 is to boot your host in single user mode.

If you are not sure how you can boot a Debian host in single user mode, you can read this tutorial that we wrote on the subject.

Change root password using single user mode root-account

Now that you are logged as root, you can run the “passwd” command in order to change the root password easily.

# passwd

Changing password for user root.
New password:
Retype new password:
passwd: all authentication tokens updated successfully.

Congratulations, you successfully changed the root password on Debian 10!

You can now simply restart your host and start playing with the root account.

Conclusion

In this quick tutorial, you learnt how you can change the root password on Debian 10 : by using the passwd command or by connecting as root and changing your password.

You also learnt that changing the root password can be done by booting your host in single user mode and running the passwd command.

Using the root account can also be quite useful if you plan on adding or deleting users on Debian 10.

If you are interested in Linux system administration, we have a complete section dedicated to it on the website, so make sure to check it out.